 Week-at-a-Glance VisWeek Sessions Exhibition Registration Student Volunteers Call for Participation Committees Week-at-a-Glance VisWeek Sessions Exhibition Registration Student Volunteers Call for Participation Committees |
|

Sessions » VAST Overview & Topics
IEEE Symposium on Visual Analytics Science and Technology (IEEE VAST), founded in 2006, is the first international symposium dedicated to advances in Visual Analytics Science and Technology. The scope of the symposium, co-located with the annual IEEE Visualization Conference (IEEE Vis) and the IEEE Information Visualization Conference (IEEE InfoVis), includes both fundamental research contributions within visual analytics as well as applications of visual analytics, including applications in science, security and investigative analysis, engineering, medicine, health, media, business, and social interaction. We invite you to participate in IEEE VAST 2008 by joining us in Columbus, Ohio and we extend a special invitation to exhibitors in the field. IEEE VisWeek brings together researchers and practitioners with a shared interest in techniques, tools, and technology.
Visual Analytics is the science of analytical reasoning supported by highly interactive visual interfaces. People use visual analytics tools and techniques in all aspects of science, engineering, business, and government to synthesize information into knowledge; derive insight from massive, dynamic, and often conflicting data; detect the expected and discover the unexpected; provide timely, defensible, and understandable assessments; and communicate assessments effectively for action. The issues stimulating this body of research provide a grand challenge in science: turning information overload into the opportunity of the decade. Visual analytics requires interdisciplinary science, going beyond traditional scientific and information visualization to include statistics, mathematics, knowledge representation, management and discovery technologies, cognitive and perceptual sciences, decision sciences, and more.
In its third year, the VAST Symposium had 58 papers submitted of which 21 were accepted by the symposium. These numbers show a slight growth trend over the past three years and are noteworthy since there are increased publishing opportunities for visual analytics in journals and other conference venues. The overall picture is of a strong and growing field with an expanding scope. Certainly that is reflected in the 21 papers presented at this year's symposium. These papers span important visual analytics topics such as investigative analysis, scientific discovery, emergency response, geo-temporal analytics, text and media analyses, social analytics, and interaction. The papers also show a growing trend in covering the entire bases that form visual analytics, with more contributions in cognition, user interfaces, user studies, narratives, evaluation, analytical reasoning, and scientific applications this year. This robust mix of fundamental research with real world applications and evaluation has created an excellent program.
Topics:
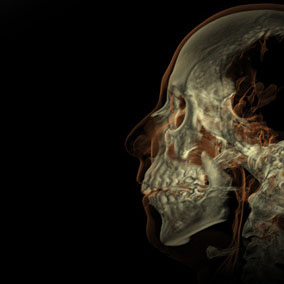
- Scientific Visual Analytics and Learning
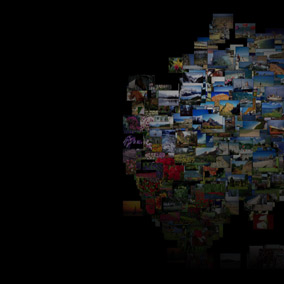
- Temporal and Spatial Visual Analytics
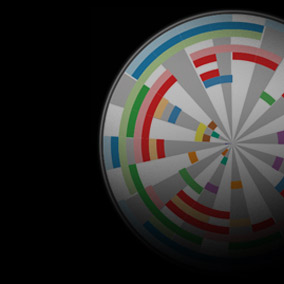
- Collaboration and Evaluation
- Reasoning, Insight, and System Aspects
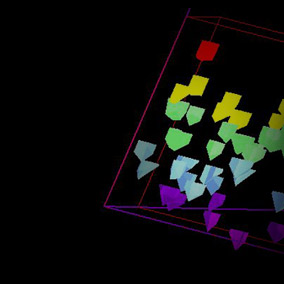
- Multidimensional Data Visual Analytics


Sponsored by the IEEE Computer Society
Visualization and Graphics Technical Committee.
© 2008 IEEE