 Week-at-a-Glance VisWeek Sessions Exhibition Registration Student Volunteers Call for Participation Committees Week-at-a-Glance VisWeek Sessions Exhibition Registration Student Volunteers Call for Participation Committees |
|

Sessions » Tutorials
» Tutorial 1 - Sunday Morning
Perception-Driven Techniques for Effective Visualization of Large Volume Data
Level: Beginner/Intermediate
Chaoli Wang, University of California, Davis (Organizer)
Han-Wei Shen, The Ohio State University
Klaus Mueller, Stony Brook University
Huamin Qu, Hong Kong University of Science and Technology
Data visualization is an iterative and exploratory process, which involves choices of parameters for queries of different types. Examples of visualization parameters include level-of-detail, color and opacity transfer function, camera position and path, lighting and so on. To reveal the important aspects of data, the users often have to go through a lengthy and expensive process to obtain a large ensemble of visualization results. With the ever-increasing size of volume data, manual data browsing through the immense, high- dimensional parameter space is no longer a viable solution. Efficient and effective solutions that search and narrow down the parameter space for assisting the users in their decision making become imperative.
In this tutorial, we introduce recent advances and emerging techniques in volume visualization towards perception-driven data analysis, rendering and presentation. The fundamental visual perception and cognitive principles are incorporated into the visualization process, thus enable presentation of relevant information for gleaning insights from the data. Selective topics include perception-informed color and highlighting, saliency-aware rendering techniques, perception-guided transfer function specification, quality enhancement of direct volume rendered images, view selection for three-dimensional and time-varying volume visualization, level-of-detail (LOD) selection for multiresolution visualization, and multiscale volume data quality assessment. The tutorial covers principles and practice of perception and cognition (such as color perception), mathematics and statistics (such as entropy theory, frequency-domain foundation, and conjoint analysis), as well as user study and evaluation. The tutorial also demonstrates the applications of those principles in visualization. The goal of this tutorial is to inform visualization researchers and practitioners the state-of-the-art technologies that leverage human perception for effective visualization of large volume data.
» Tutorial 2 - Sunday Morning
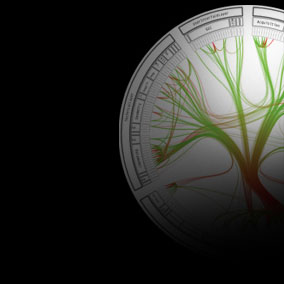
Information Visualization with VTK
Level: Intermediate
Brian Wylie, Sandia National Laboratory (Organizer)
Jeffrey Baumes, Kitware, Inc
Timothy Shead, Sandia National Laboratory
John Greenfield, Sandia National Laboratory
The merging of information visualization and scientific visualization is an active area of research, development and discussion. Recently the Visualization Toolkit (VTK) has been expanded with new data structures and a large set of filters, views, database adapters and other components that support the processing of informatics data. Our tutorial gives a detailed overview of the new components and demonstrates their use within the flexible pipeline architecture. Attendees will learn the basics of using VTK for information visualization with a focus on building quick, functional applications. The tutorial will also demonstrate how users can extend the current capabilities to include their own functionality.
» Tutorial 3 - Sunday Afternoon
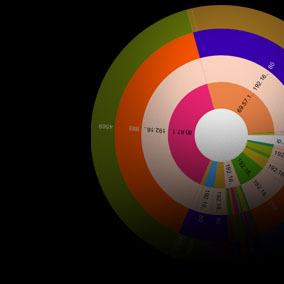
Color in Information Display: From Theory to Practice
Level: Beginner/Intermediate
Maureen Stone, StoneSoup Consulting (Organizer)
Color theory is routinely taught in both design and technical courses on information visualization to promote the effective use of color. However, applying these principles is not easy. This course is designed to aid those interested in applying color effectively to computer-generated visualization and analysis. It will provide specific examples and concrete principles, including: a case study the color design for Tableau Software's suite of tools for data visualization and analysis; an in-depth look at metrics for lightness, contrast and legibility; guidelines for accommodating color vision deficiencies; practical guide and demonstration of display calibration.
Value: To promote the effective use of color by providing concrete examples, formulas and recommendations.
» Tutorial 4 - Sunday Afternoon
Mashup Visualization with Google Earth and GIS
Level: Beginner
Jason Dykes, City University, London (Organizer)
Jo Wood, City University, London
This active tutorial has been designed to equip Information Visualization specialists with skills in using geographic information techniques and technologies.
Key issues in Geographic Information Science that are fundamental to effective geovisualization will be highlighted and accessible technologies used to develop example analytical applications using a 'mashup' approach.
Having completed the tutorial participants will be able to:
- specify spatial entities in KML for visualization in Google Earth
- encode symbolism and interactions in KML for visualization
- visualize continuous surfaces in a GIS
- use visualization to compare and contrast representations of geographic data in an analytical context
These methods allow participants to build a geovisualization application from diverse data sources.
Access to a notebook computer will be required and participants will be asked to install freely available software in preparation for the 'hands on' tutorial.
No prior experience with using geographic information or GIS is assumed. No programming skills are required.
Suggested maximum class size: 40.
» Tutorial 5 - Monday (3/4 Day)
Part I: Experimental Design and Analysis for
Human-Subject Visualization Experiments
Part II: Perceptual Issues
for Visualization and Evaluation
Level: All
Ed Swan, Mississippi State University (Organizer)
Mark A. Livingston, Naval Research Laboratory
These tutorials will discuss two related issues: the design and analysis of human-subject experiments, and perceptual issues that are often the subject or complicating factors in such designs.
Part I of the tutorial will illustrate basic aspects of experimental design and data analysis techniques.
Part II of the tutorial will explore perceptual issues that affect the design of perceptual experiments, with emphasis on motion and attention. Thus this tutorial offers insights into considering possible hypotheses for perceptual aspects of visualization and into methods that will enable visualization designers to test those hypotheses according to established techniques. While both parts of this tutorial build upon previous offerings, visualization designers and evaluators at all levels of experience are expected to benefit.
» Tutorial 6 - Monday (3/4 Day)
Advanced Paraview Visualization
Level: Intermediate/Advanced
Kenneth Moreland, Sandia National Laboratory
(Organizer)
David Thompson, Sandia National
Laboratory
Timothy Shead, Sandia National
Laboratory
John Biddiscombe, Swiss National
Supercomputing Centre
Utkarsh Ayachit, Kitware, Inc
ParaView is a powerful open-source turnkey application for analyzing and visualizing scientific data sets ranging from small desktop-sized problems to the worlds largest simulations and is used by numerous government, educational, and commercial institutions throughout the world. Designed to be configurable, extendible, and scalable, ParaView is built upon the Visualization Toolkit (VTK) to allow rapid deployment of visualization components. This tutorial brings together several of those who helped design and build ParaView give visualization researchers and developers detailed guidance on the behavior and abilities of the ParaView application. This knowledge will allow the tutorial participants to solve their unique visualization problems, to modify the ParaView application to their specific problem domains, or to leverage the design into their own applications. A variety of topics will be discussed during the tutorial. Participants will learn how to customize their visualization with selection, scripting, plugins, and vertical applications. The tutorial will feature how ParaView handles time and parallelism. We will also provide information on some new and advanced features including higher order elements, particle visualization, and information visualization.
» Tutorial 7 - Tuesday Morning
GPU-Based Volume Ray-Casting with Advanced Illumination
Level: Intermediate/Advanced
Timo Ropinski, University of Muenster (Organizer)
Christof Rezk-Salama, University of Siegen
Markus Hadwiger, VRVis Research Center
Patric Ljung, Siemens Corporate Research
GPU-based ray-casting techniques are becoming more and more important for the visualization of volume data in medicine and engineering. Thanks to their flexibility and accuracy, they will likely replace existing slice-based techniques in the near future. This tutorial targets the growing number of developers and scientific researchers who work with specialized volume visualization algorithms on state-of- the-art graphics hardware. Starting with a brief introduction to the concepts behind GPU-based ray-casting, we will review existing techniques capable to accelerate the rendering performance. These acceleration techniques are the key issue for supporting advanced illumination models, since these models usually consume more rendering time. In contrast to commonly used local illumination models, advanced illumination models allow to incorporate the light interactions between neighboring structures. Such effects include soft and hard shadows as well as translucency and multiple scattering. The tutorial focuses strongly upon those effects, which support improved spatial comprehension and are thus relevant for scientific visualization from a perceptual point of view, but it also covers topics more related to visual arts.
» Tutorial 8 - Tuesday Morning
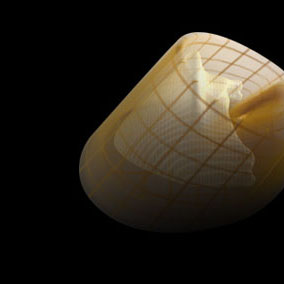
Interactive Lattice-Based Flow Simulation and Visualization
Level: Intermediate/Advanced
Ye Zhao, Kent State University (Organizer)
Arie Kaufman, Stony Brook University
Klaus Mueller, Stony Brook University
Nils Thuery, ETH Zurich
Ulrich Rüde, University Erlangen-Nürnberg
The advances in applying physical models and numerical PDE (Partial Differential Equation) solvers for flowsimulation, along with the rapid increase in computer power, open a new era in a variety of fields and applicationdomains in computer graphics and visualization. As a unique explicit, simple and inherently-parallel scheme, the latticeBoltzmann method (LBM) has developed into a promising numerical method for simulating fluid flows and modelingphysics in fluids. It has achieved great success in the world of computational physics both from the analytical andpractical points of view. The LBM scheme excels due to its very efficient and simple computing process for modelingfluid dynamics even in the presence of very complex boundary conditions, such as arbitrarily-shaped obstacles, movingobjects, free surfaces and the like. Due to its discrete nature, the LBM lends itself well to efficient interface tracking asto adaptive and multi-resolution approaches, which are both critical for flow simulations in realistic graphicsapplications. Moreover, its computational pattern, which is similar to cellular automata, is easily parallelizable. Thismakes the LBM very amenable to acceleration on parallel computers, such as single GPUs (Graphics Processing Unit)and for GPU clusters, enabling it to achieve interactive or real-time flow simulation performance in a scalable fashion.Due to these many merits, the LBM continues to gain momentum and adoption within the computer graphics andvisualization community for the modeling of various fluid phenomena. But despite these positive trends, the power ofthis parallel lattice-based scheme has still not been fully utilized, and we feel that this is mostly due to the lack ofproper education activities in the method's underlying principles. Fortunately, unlike other simulation methods incomputational physics, the LBM's ease of use and acceleration, and especially its well-known gentle learning curve,make it relatively easy for users to become proficient. The authors of this tutorial have a long history in applying theLBM for the modeling of a wide variety of flow phenomena. Since the year 2001, these works have lead to numerousresearch papers, presentations and collaborative outreaching projects. We found this period a very enjoyable one andwe are extremely optimistic for these successes to persist in the near and far future. In this course, we hope to share thisenthusiasm with the audience who are interested in interactive and real-time flow simulation and visualization. We areaiming to educate attendees in the proficient use of the LBM in various application domains: for the development ofcomputer graphics and games, for prediction simulation capabilities, and for general computational science andengineering.
» Tutorial 9 - Tuesday Afternoon
Functional Streaming
Level: Intermediate
David Duke, University of Leeds (Organizer)
Rita Borgo, University of Leeds
Malcolm Wallace, University of York
C. Runciman, University of York
This tutorial introduces a new way of thinking about visualization algorithms and systems. Functionalprograms are concise, high level, problemorienteddescriptions. The lazy evaluation model underlyinglanguages such as Haskell supports a novel idiom for implementing visualization algorithms, throughdemanddrivenstreams. The spaceperformanceproperties of this approach falls naturally betweenpurely incoreand outofcoremethods, without the need for the explicit management of chunking. Atthe same time, powerful type systems allow the programmer to create generic programs that factor outdependencies on data organisation while documenting, in a machine checkable framework, importantassumptions linking data and algorithm.Advances in functional programming have taken place largely in isolation from those in visualization.From a visualization perspective, FP may seem esoteric, and disconnected from the computationalchallenges of largescaledata analysis and depiction. But functional languages and programming offera fresh perspective on these challenges, from the use of streaming as an idiom (echoing recent trends ingraphics hardware), through to reusable abstractions and the 'glue' with which they can assembled intosystems that combine visualization techniques at a fine granularity than enabled through existingmodular environments.
» Tutorial 10 - Tuesday Afternoon
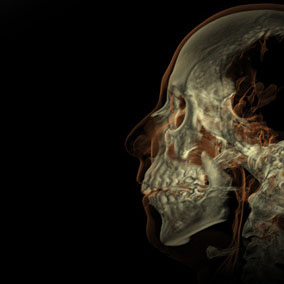
Advanced Visual Medicine: Techniques for Visual Exploration & Analysis
Level: Intermediate/Advanced
Christian Tietjen, University of Magdeburg (Organizer)
Dirk Bartz, University of Leipzig
Steffen Oeltze, University of Magdeburg
Felix Ritter, MeVis Research
Tim Peeters, Eindhoven University of Technology
Stefan Zachow, Zuse-Institute Berlin
One of the largest application domains of visualization is medicine. 3D visualization techniques areessential in both daily health care practice and in clinical research. In particular recent developmentsin image acquisition, diagnostic procedures and minimally- invasive surgery enable and require an advancedplanning and intra- operative support through computer science methods. With the increasedspatial and temporal resolution, 3D visualizations become important for selected diagnostic proceduresand for a wide range of therapy planning scenarios ranging from cardiac diagnosis to neurosurgical interventions.In particular time-varying 3D data requires dedicated visualization and analysis methods.Finally, the advent of intraoperative navigation gives rise to augmented reality techniques to supportmedical doctors during surgery.In this tutorial, we give examples and discuss strategies how to derive visual solutions for specificclinical problems. Therefore, we explore a variety of advanced topics of visual medicine. In particular,we will discuss the use of illustrative visualization techniques, visualization of multimodal volume data,visual analysis of perfusion data, diffusion tensor imaging, OR-fit mixed reality methods for surgery,and computer-assisted surgery--some of the most actively researched fields in visual medicine.


Sponsored by the IEEE Computer Society
Visualization and Graphics Technical Committee.
© 2008 IEEE