| Image | Description |
|---|
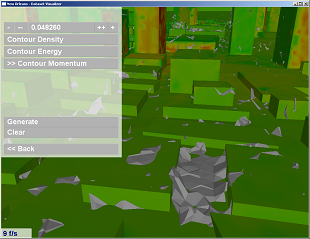 |
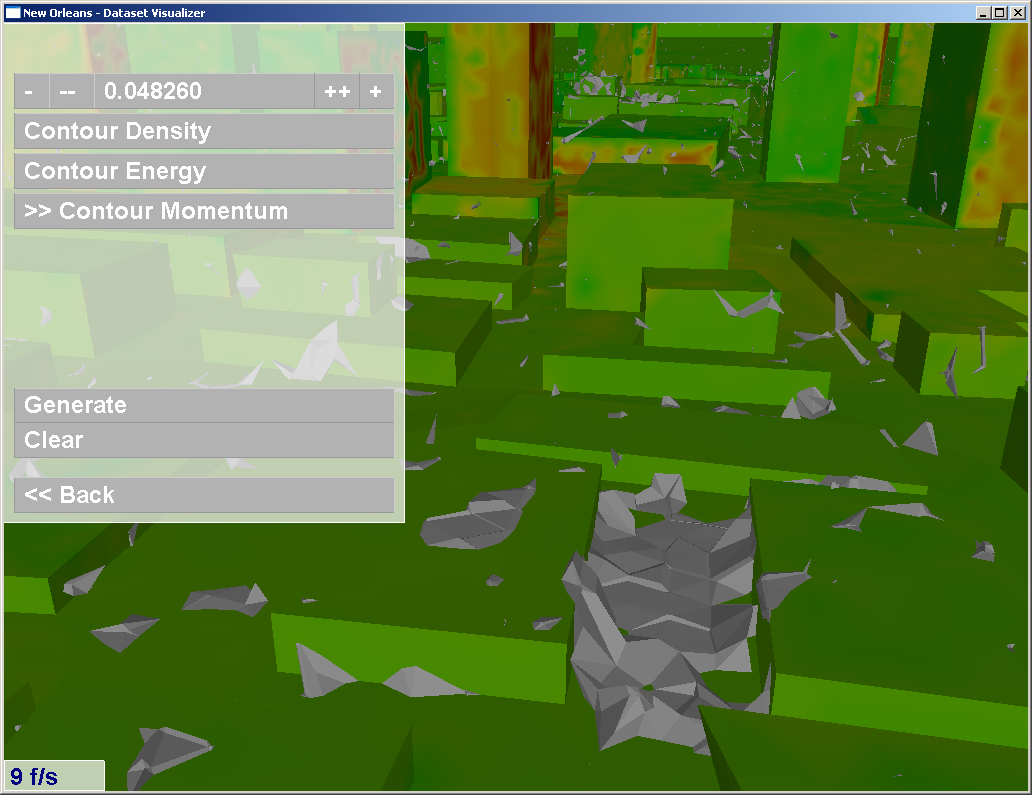
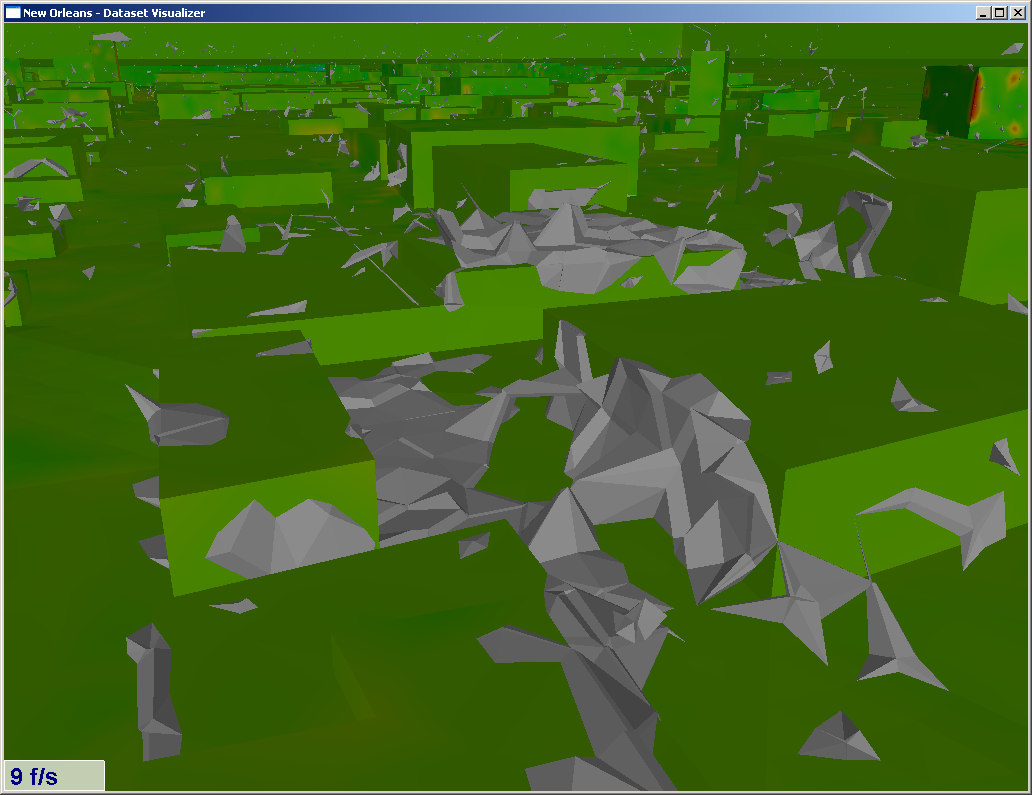
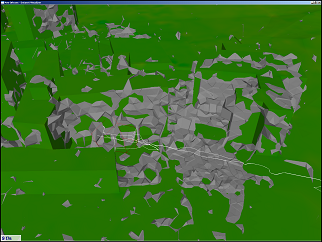
An isosurface of Momentum Magnitude = 0.04826, Showing a wind shielded alley |
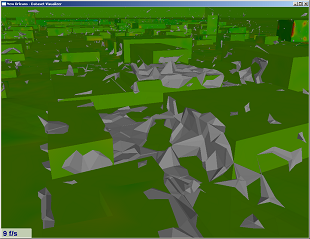 |
An isosurface of Momentum Magnitude = 0.04826, Showing a wind shielded alley and a rooftop shielded from the wind by a taller building |
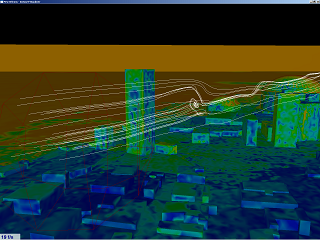 |
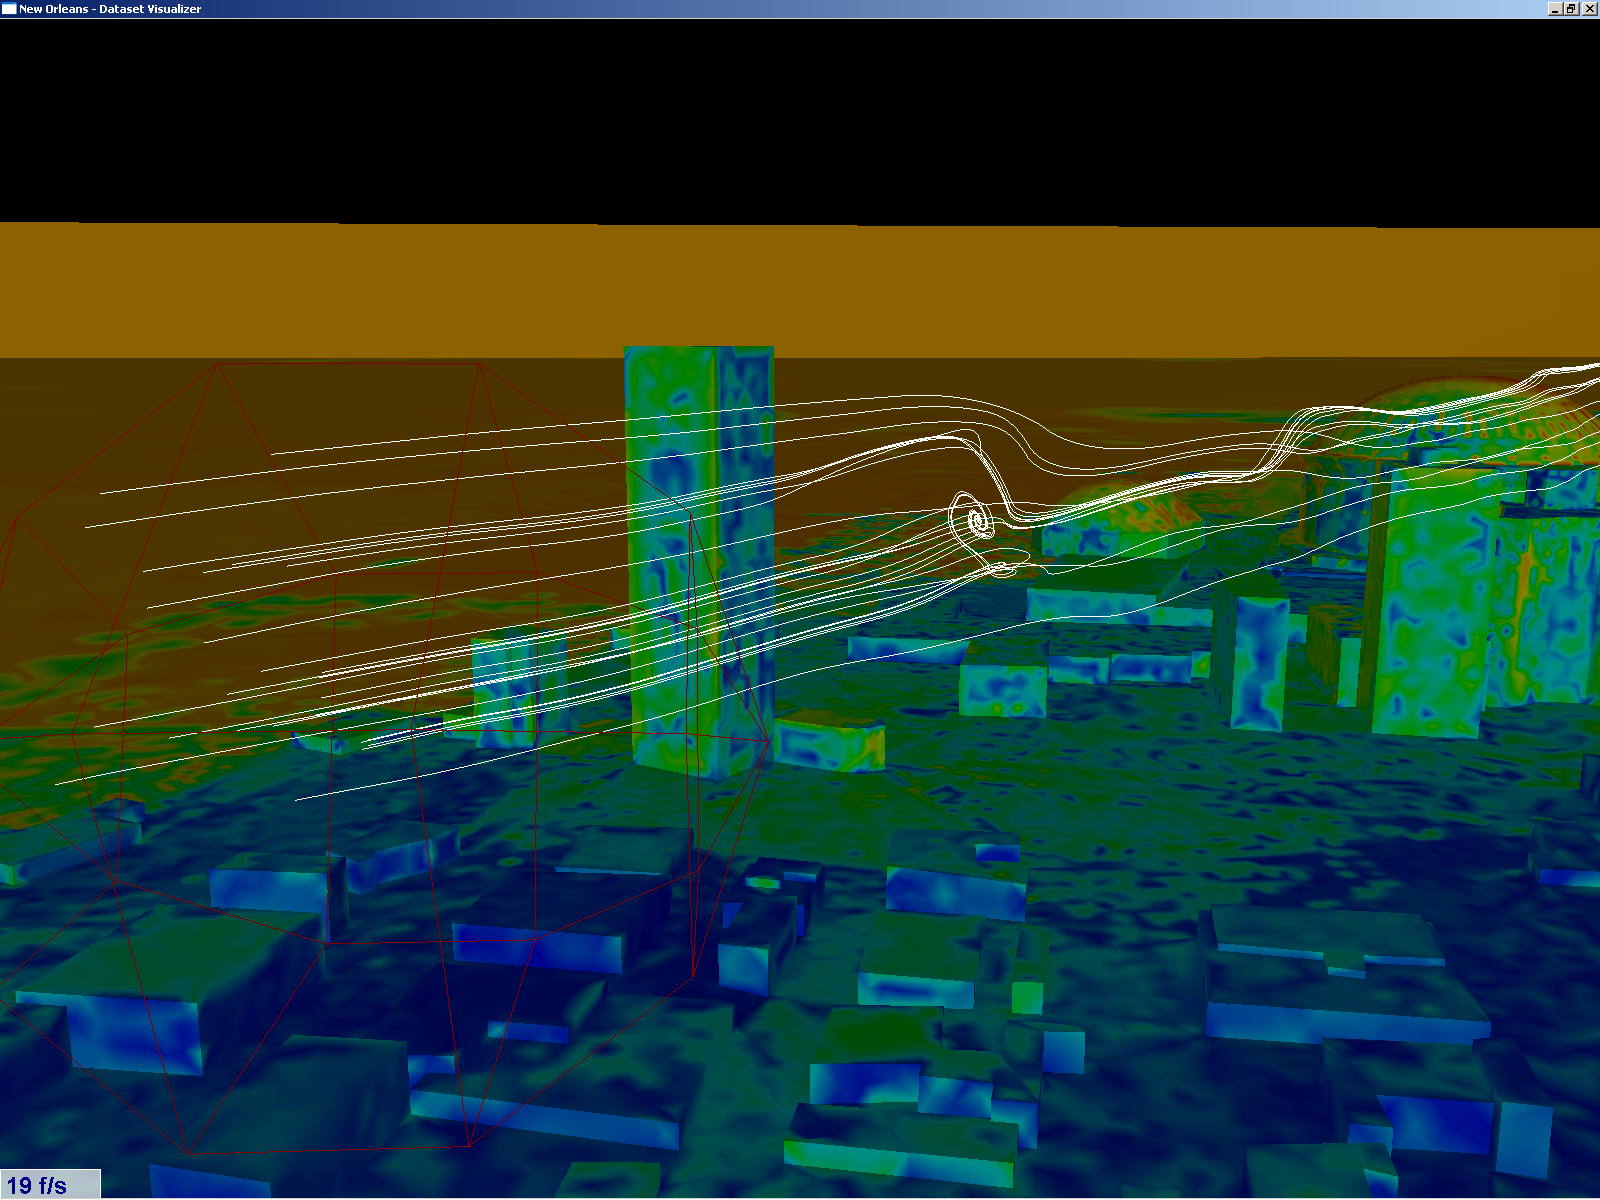
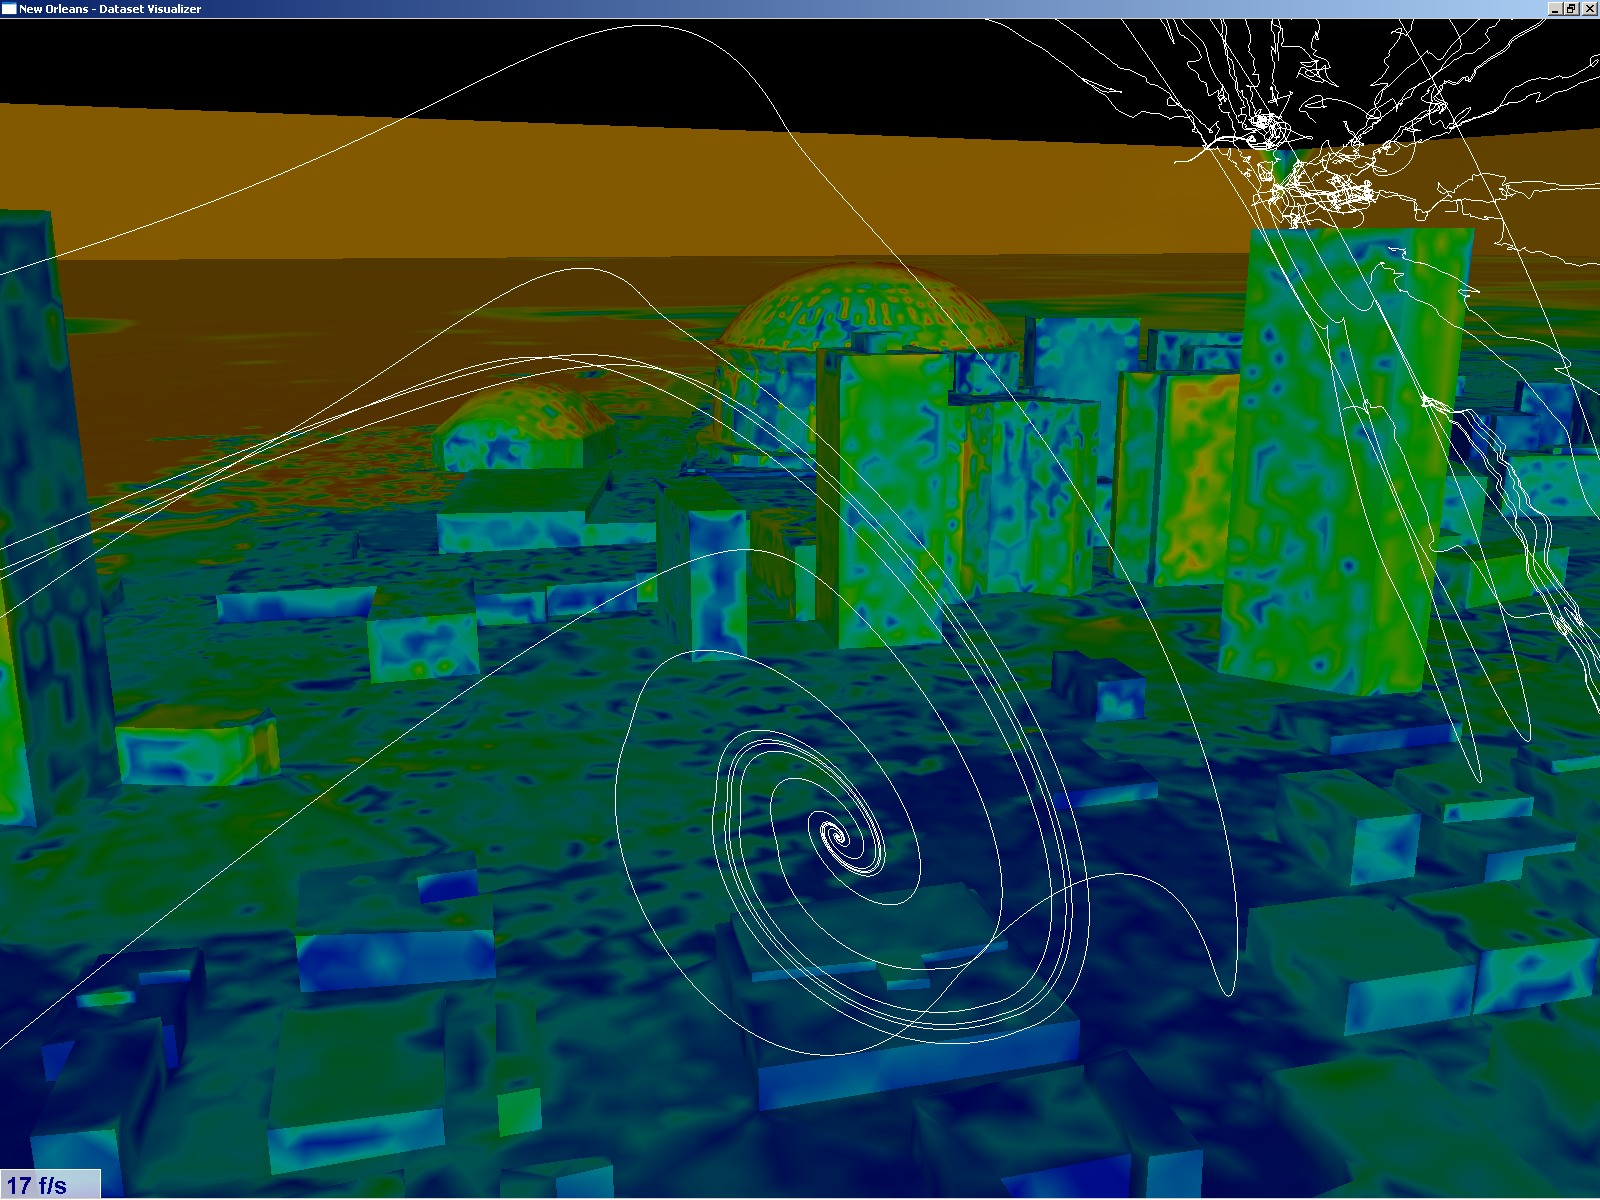
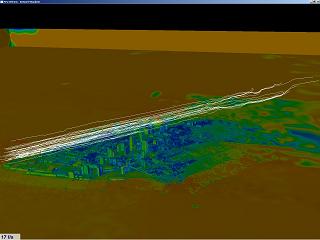
Pathlines showing a wind vortex high above the city |
 |
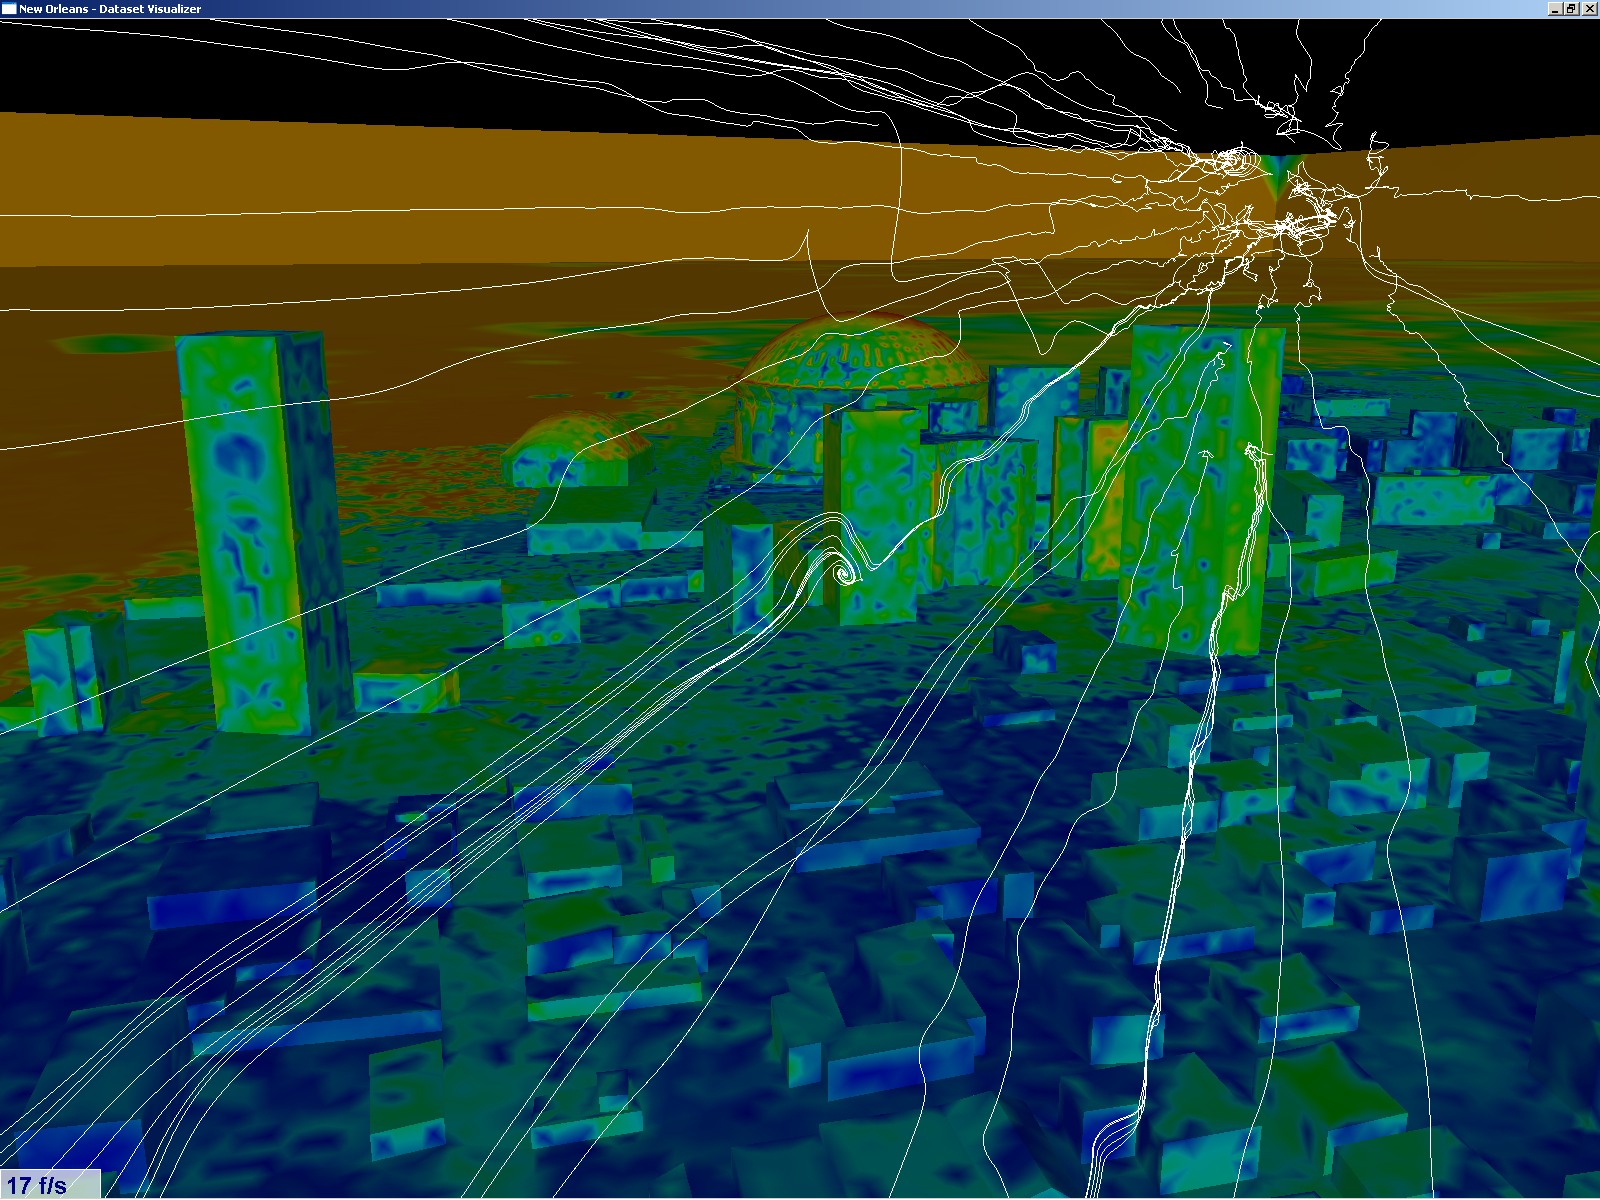
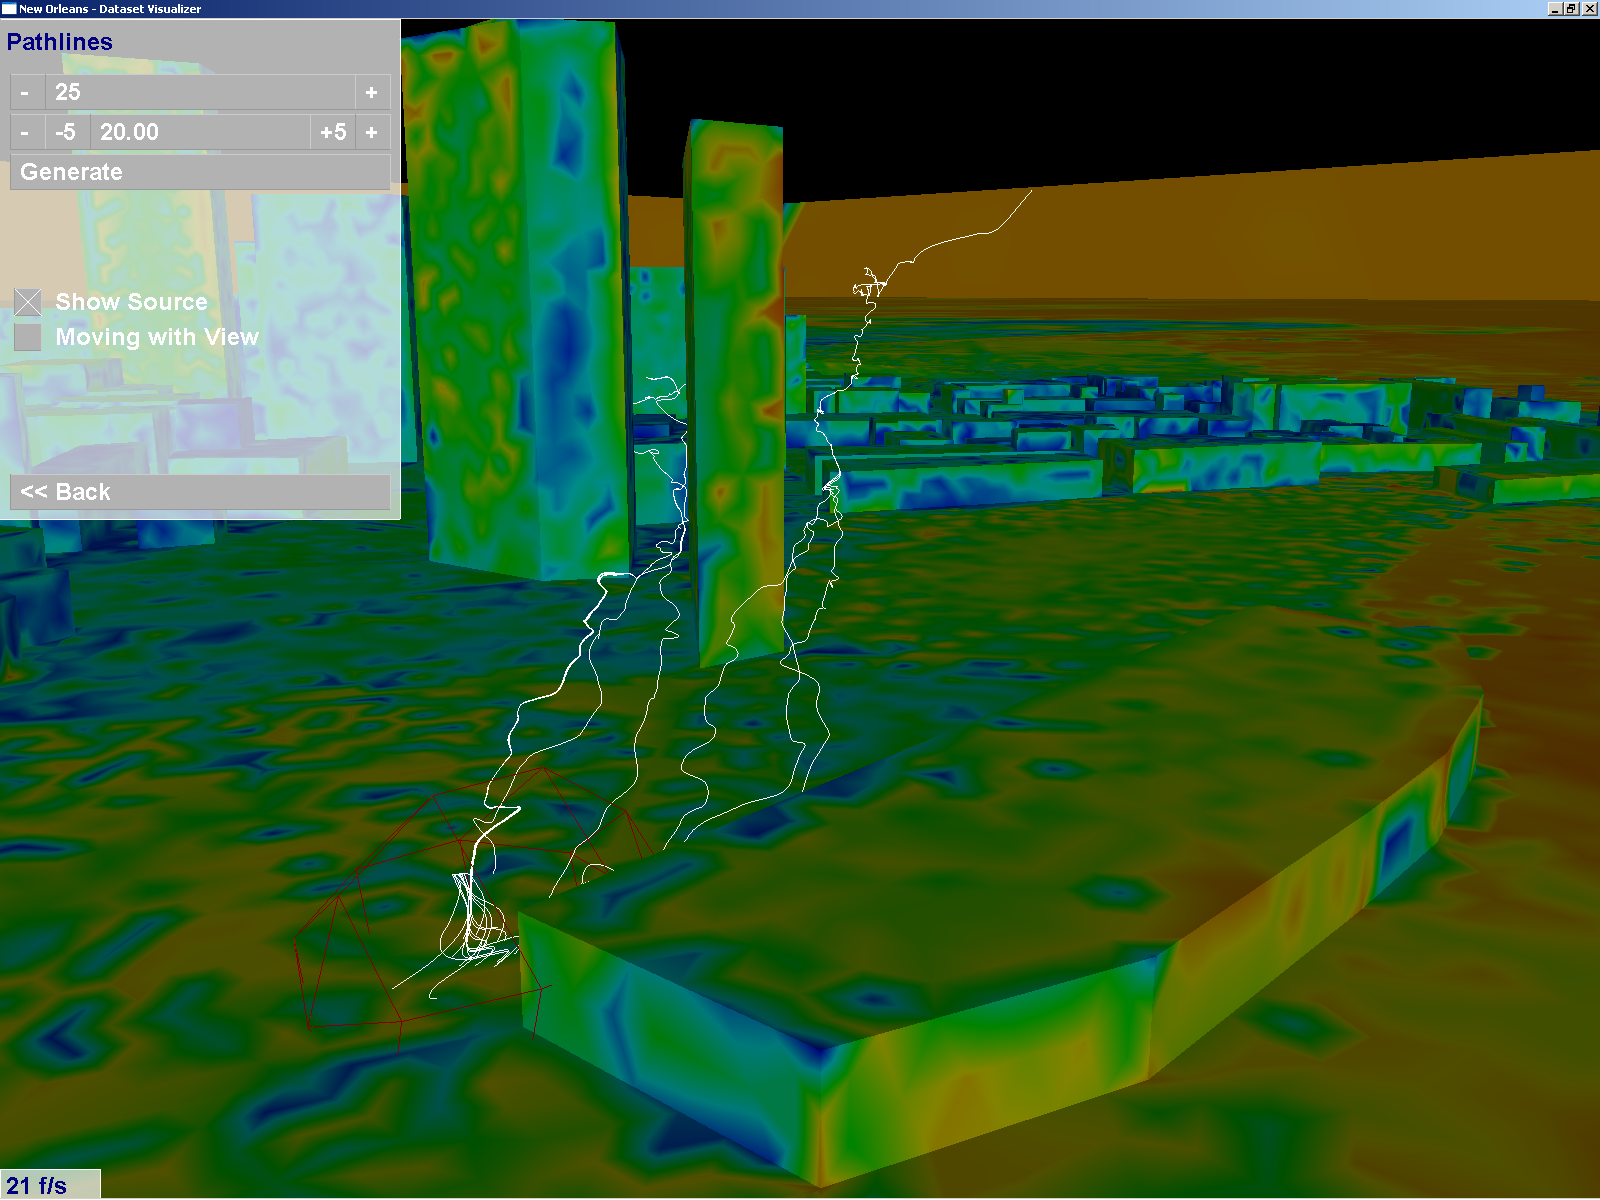
Pathlines colliding with a tall building, and diverting around it |
 |
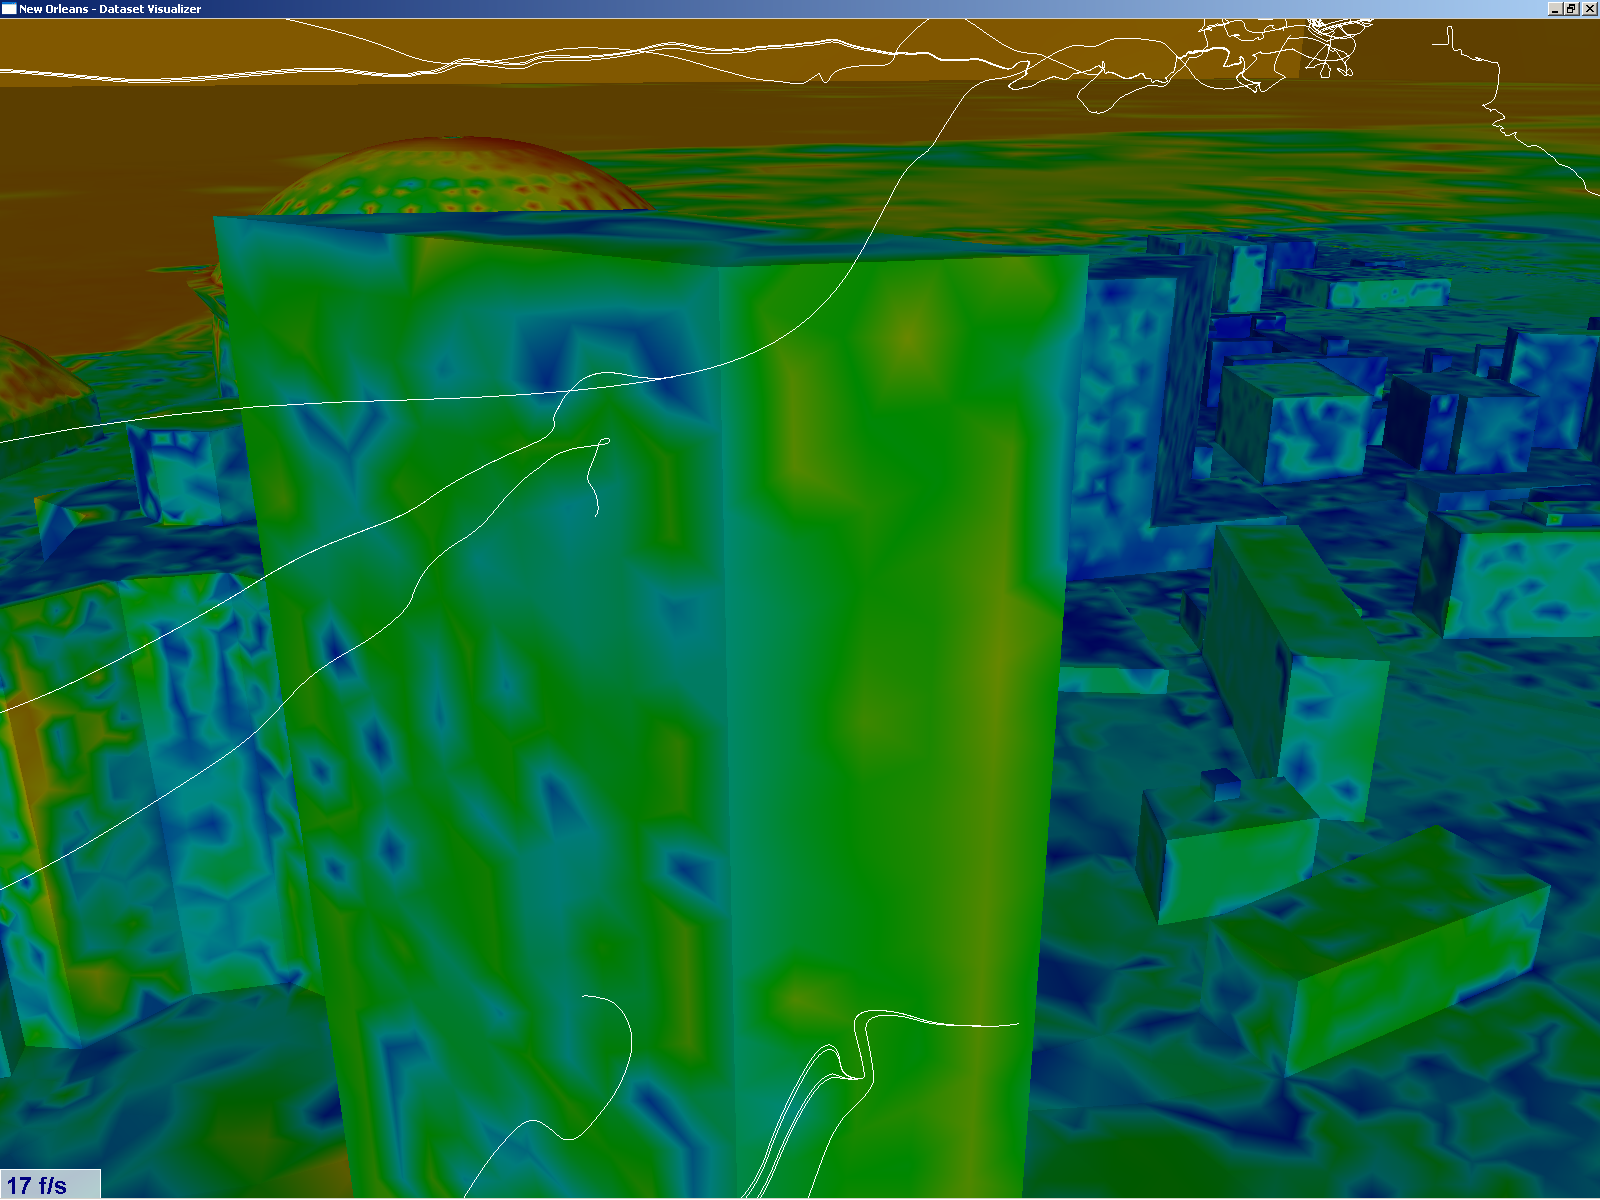
Closeup of a pathline vortex high above the city |
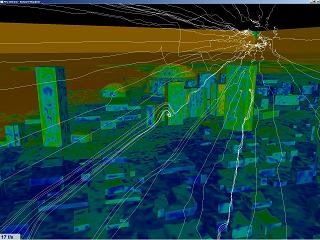 |
Discovery of a pathline vortex, with other nearby pathlines showing how air diverts around it |
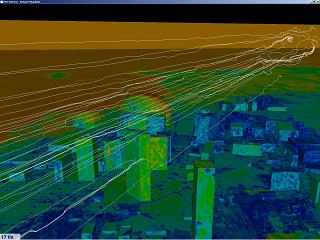 |
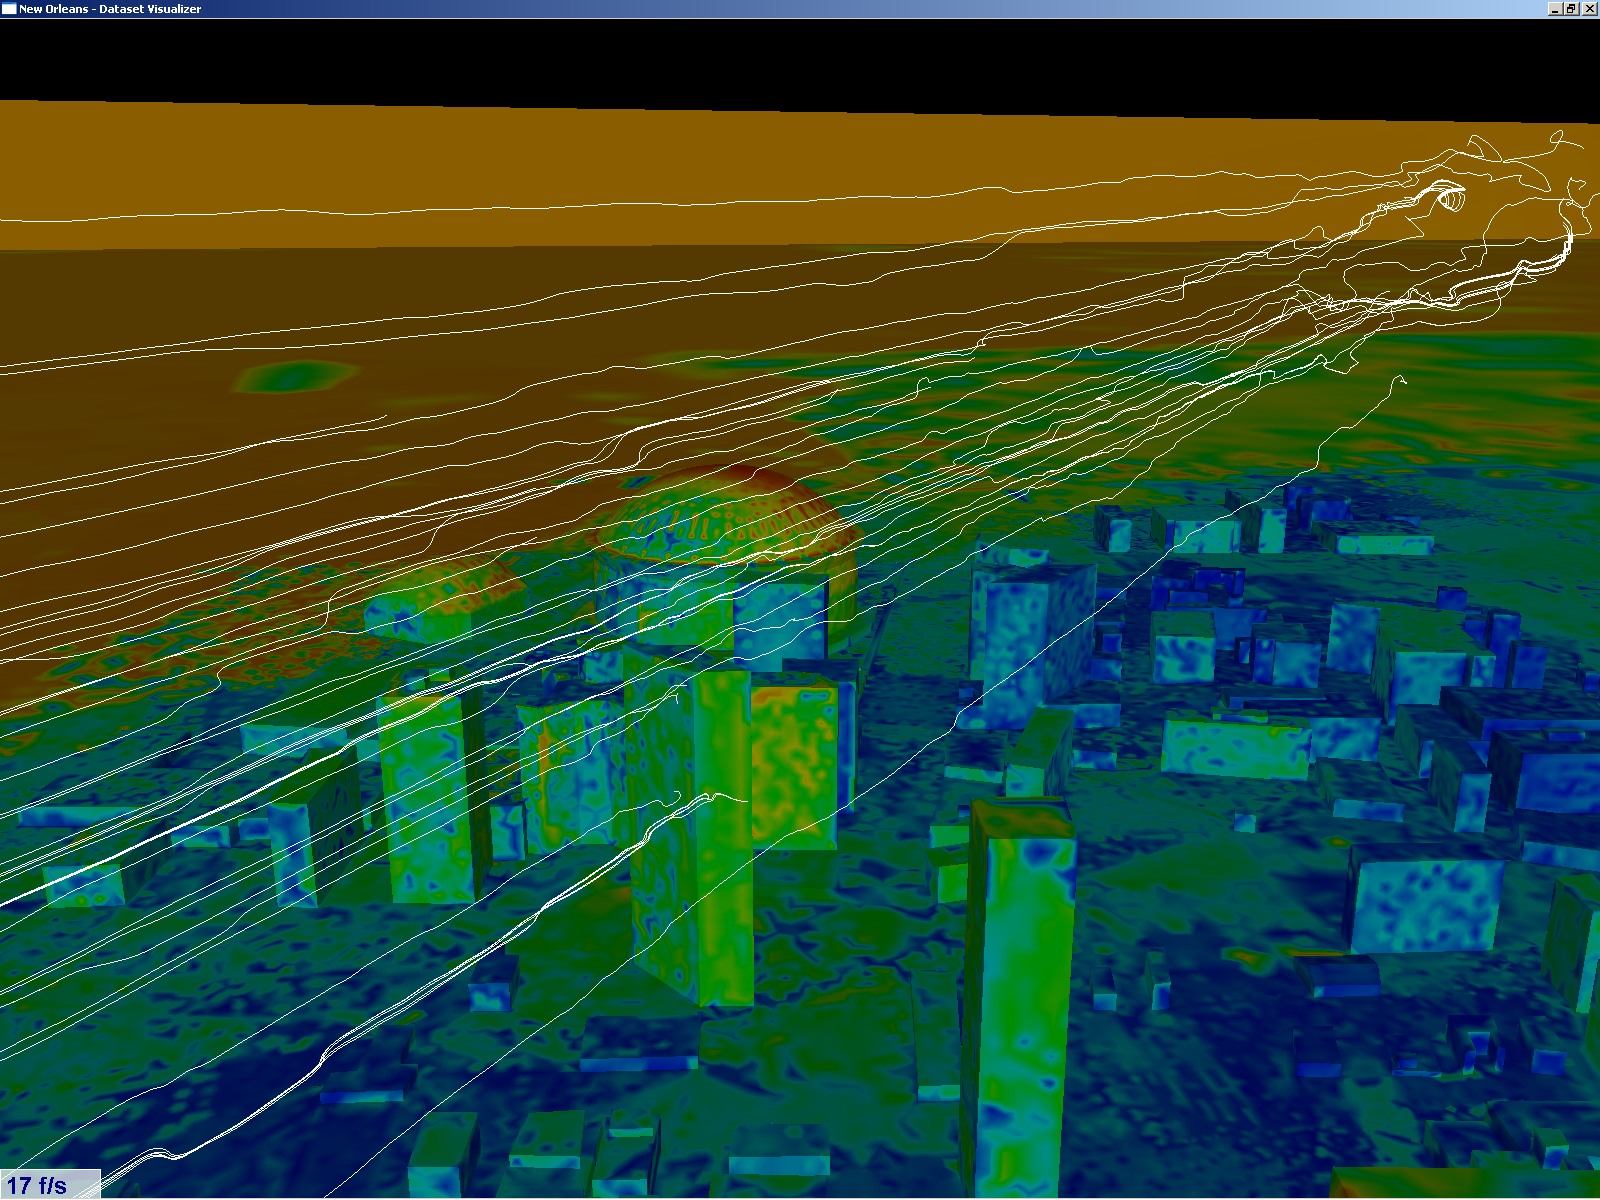
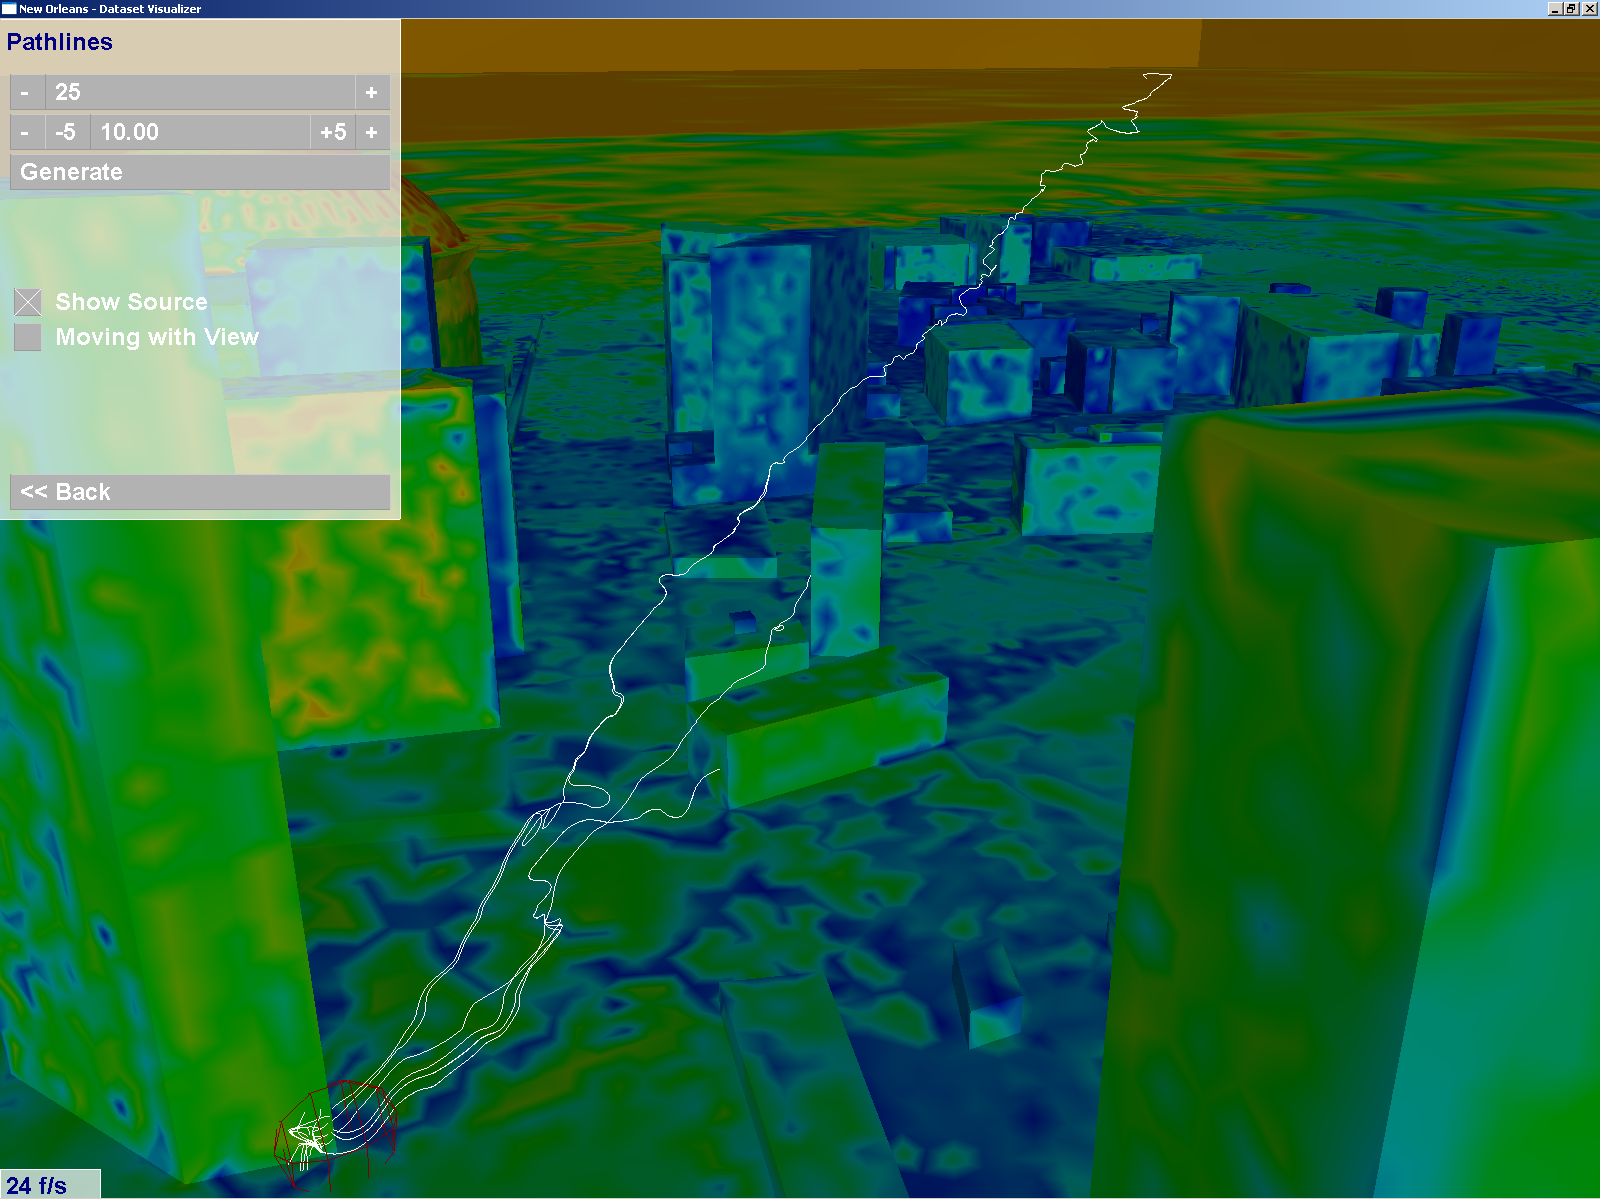
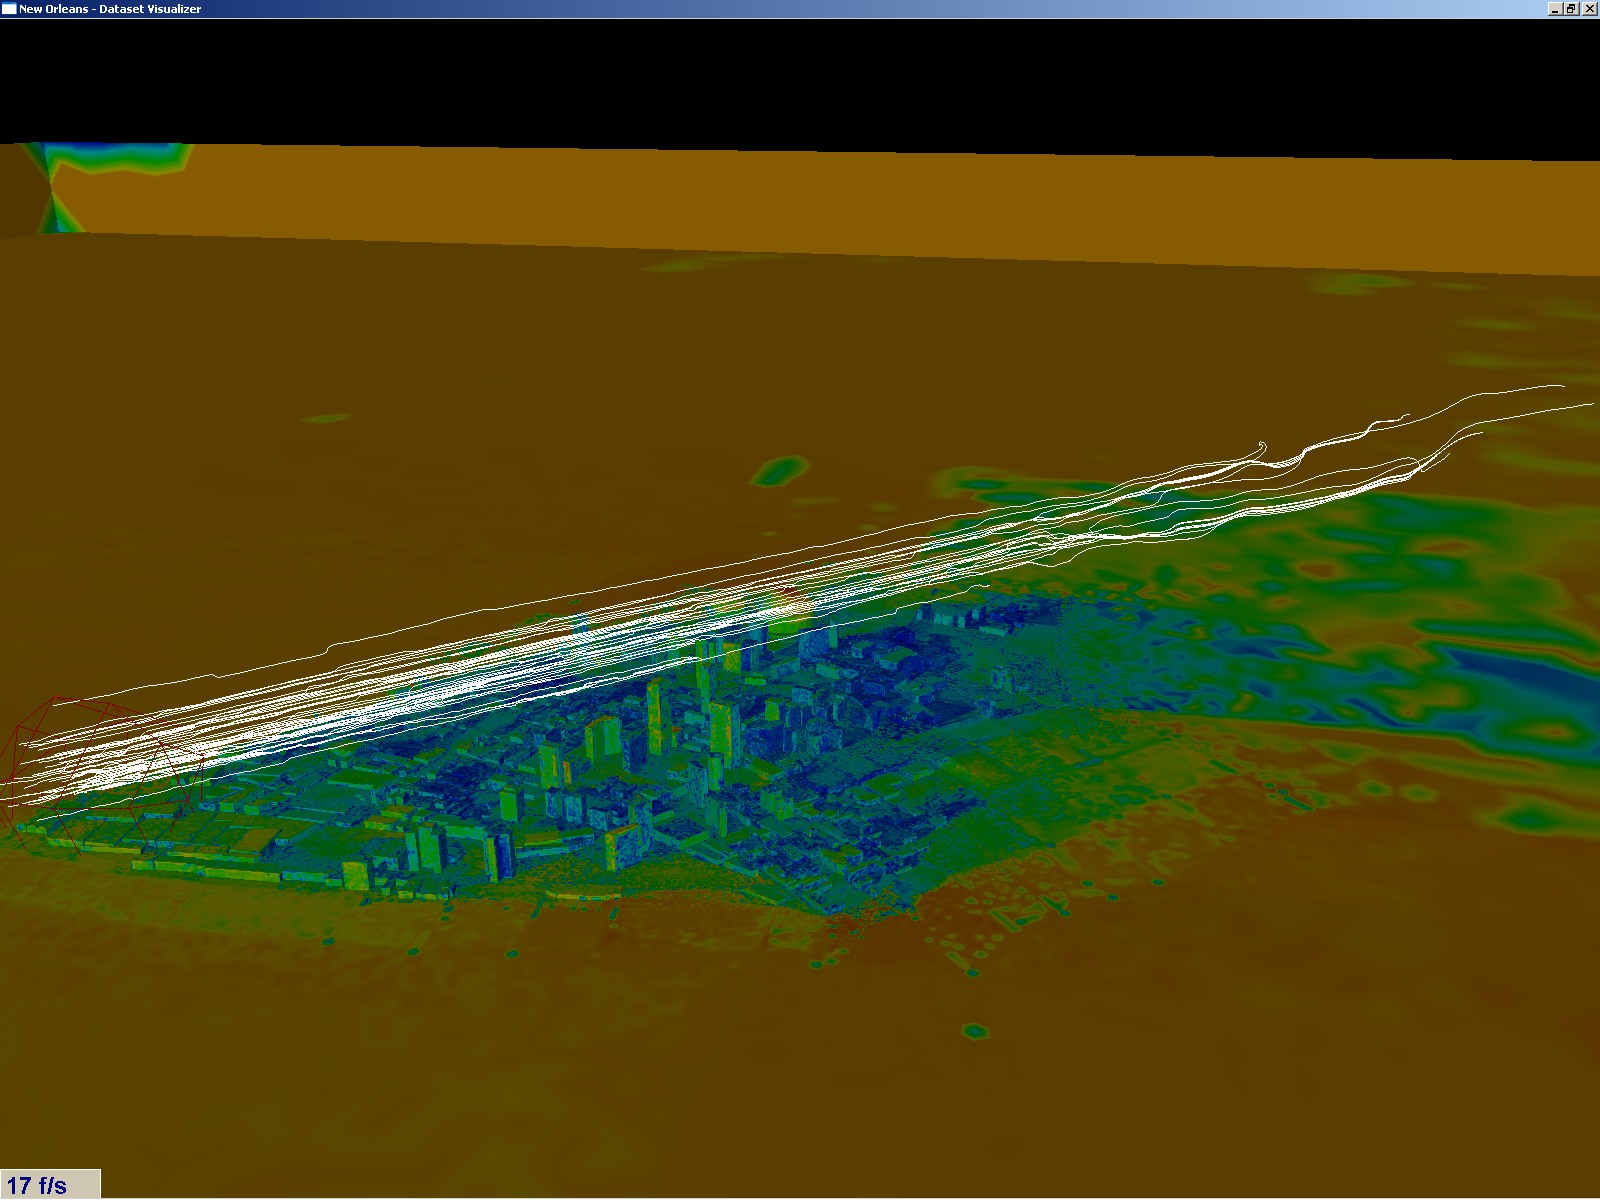
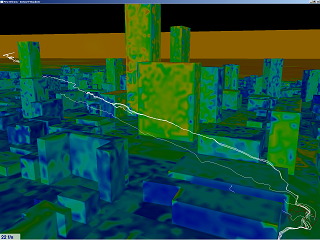
A full shot of pathlines passing through the city |
 |
Wind pathlines flowing through a wind shielded alcove, created by several neighboring buildings |
 |
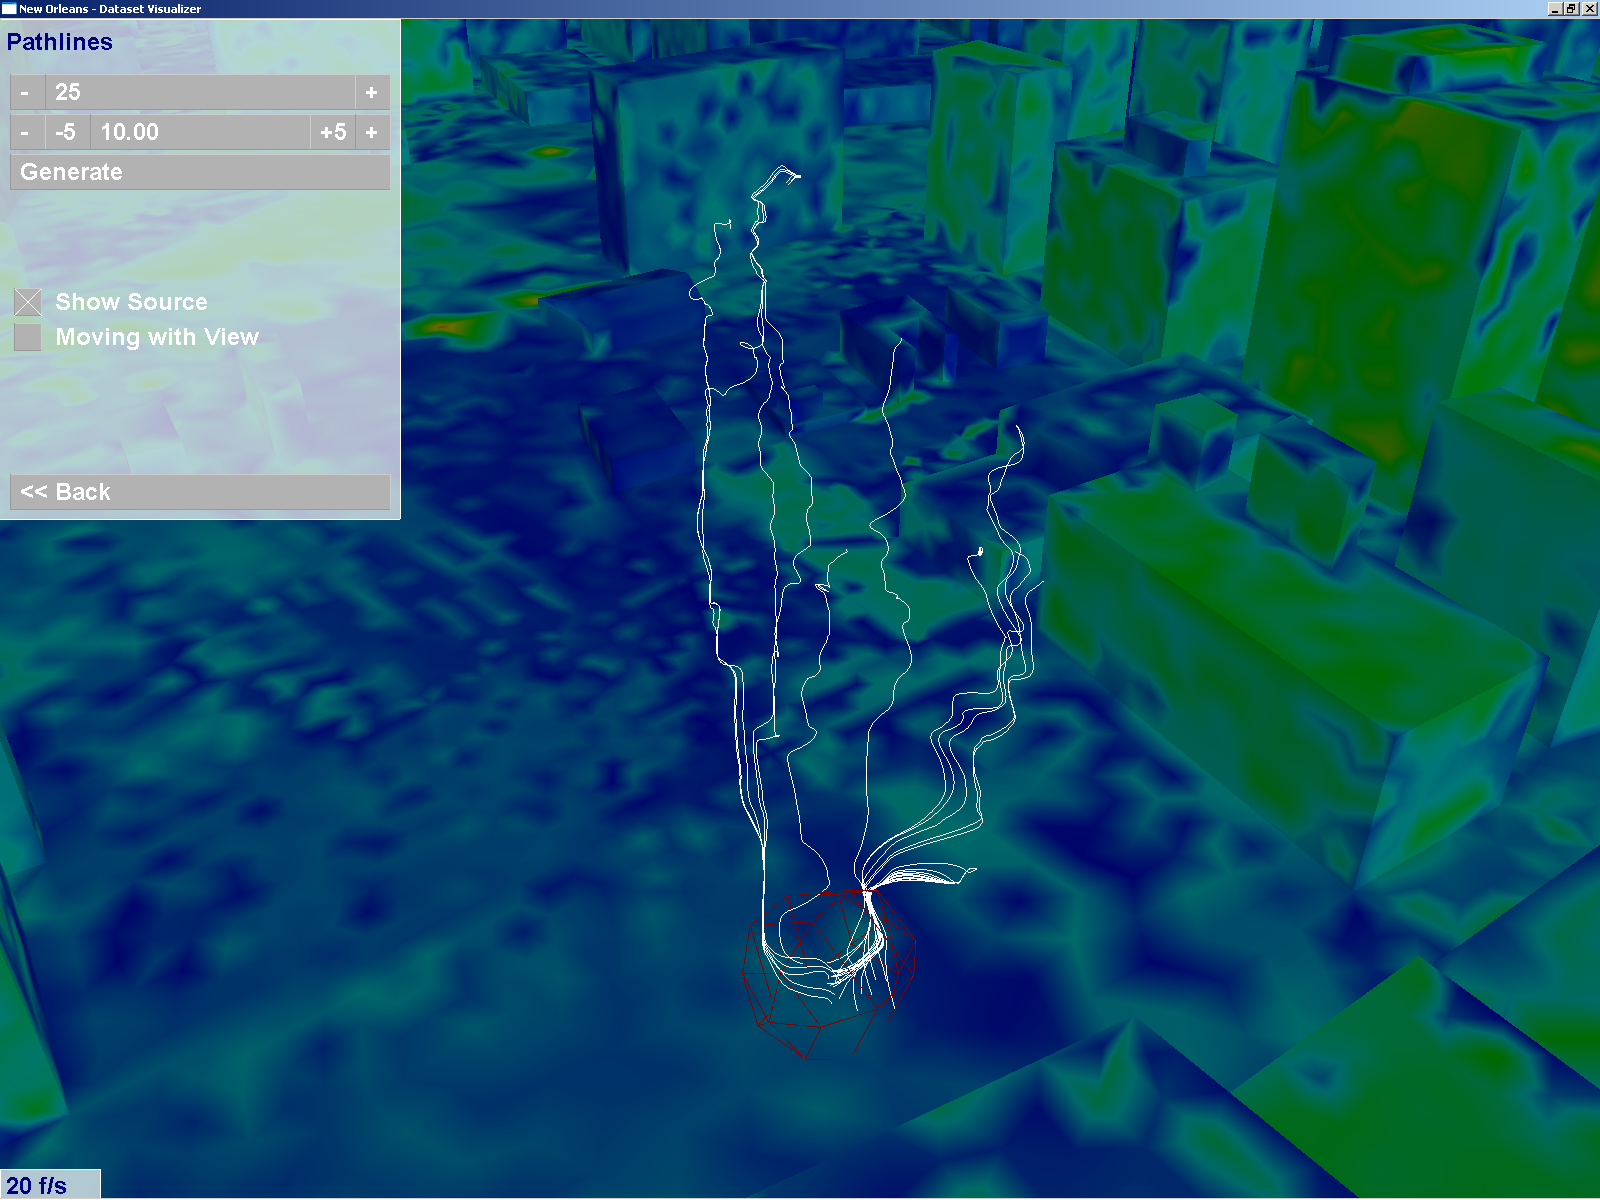
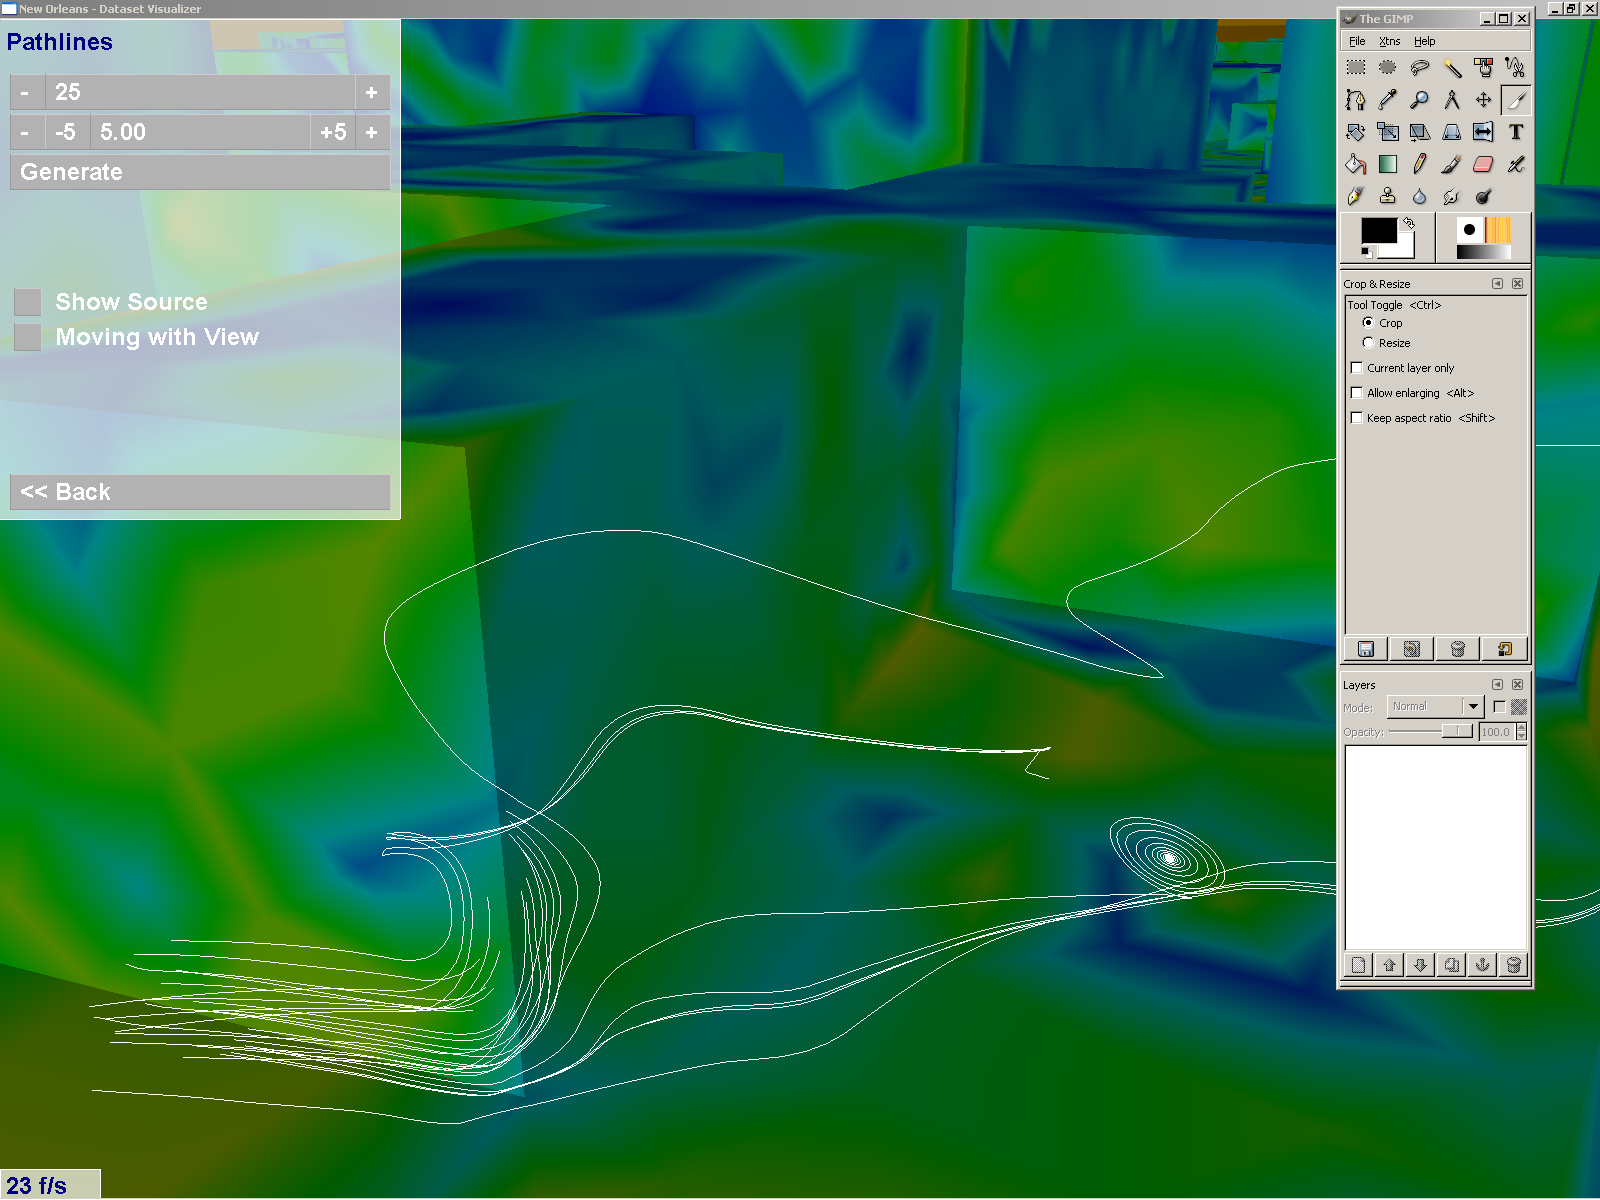
Release of a pollutant at ground level in a courtyard. Several large vortices are shown, indicating areas that would be heavily exposed
|
 |
Release of a pollutant in a courtyard near the back of a building, in a wind shielded area, showing how widely the initial dispersion is. |
 |
Release of a pollutant near the back of that same building, this time in a corner between it and a nearby building. This shows how far a pollutant could travel. |
 |
Releasing a pollutant at the corner of a building in a vortex, with a long travel time |
 |
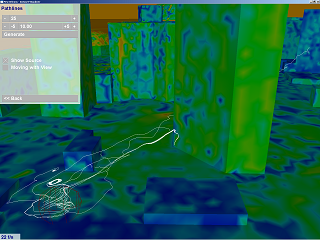
Release of a pollutant in a wind shielded alley, showing how the pollutant can freely travel upwards into high winds traveling over the alley, and travel long distances. |
 |
Release of a pollutant at the corner of a building. Here you can see the pollutant is initially dispersed quite widely through the aide of a vortex at the building's corner, then it is dispersed further by an obstructing building with a sharp edge toward the wind. |
 |
A closeup of a pollutant using a building-corner wind vortex to gain altitude |
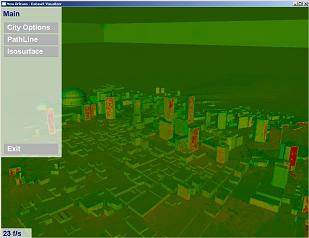 |
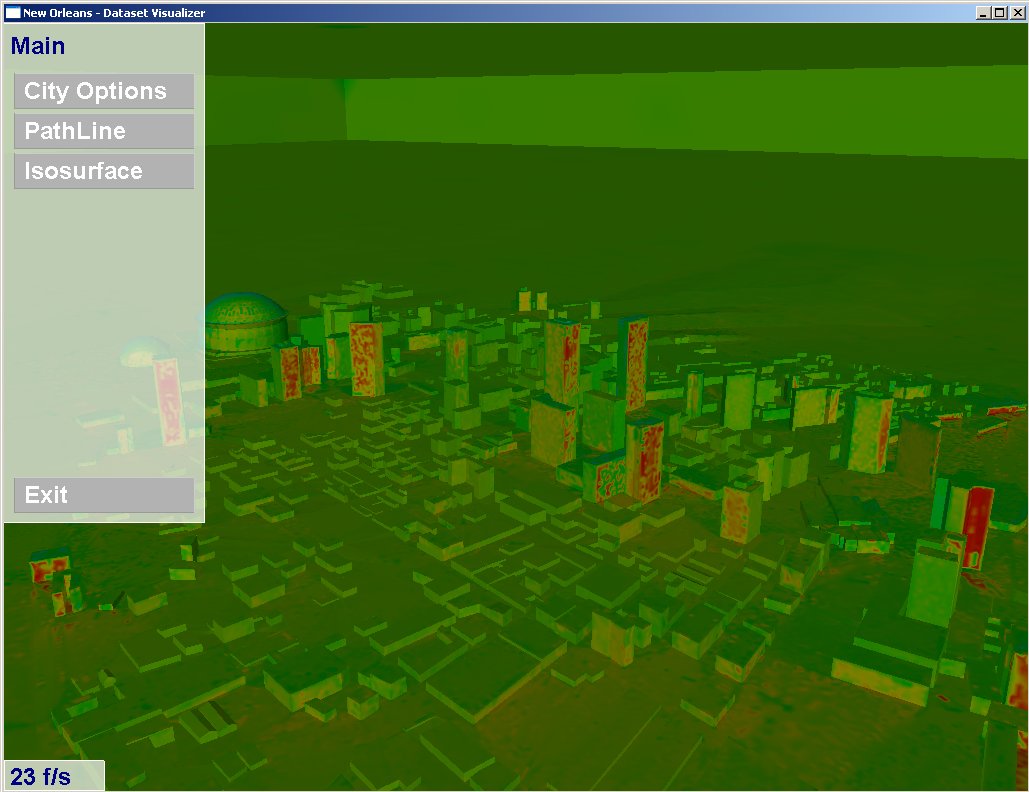
The initial state of the program. |
 |
Full shot of the windfield structure over the city |
 |
The Isosurface User Interface. You can see the variable selection & value selection areas. |
 |
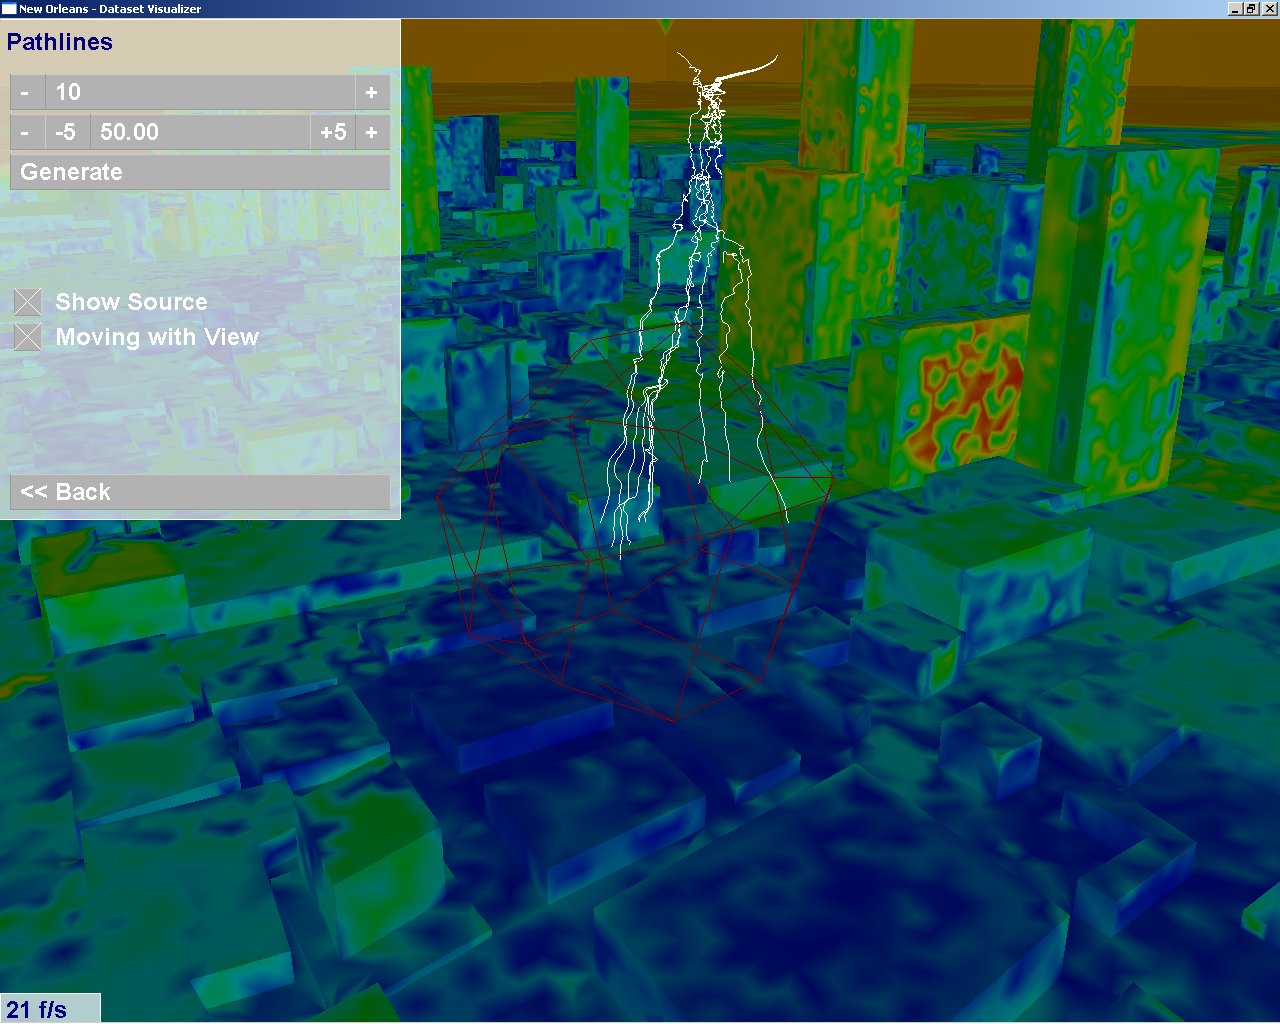
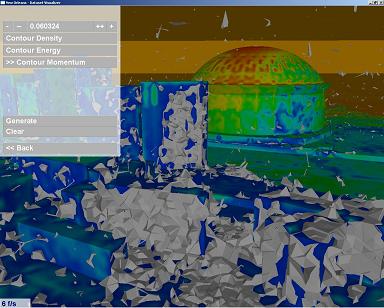
Pathline User Interface. |
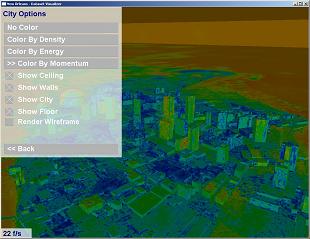 |
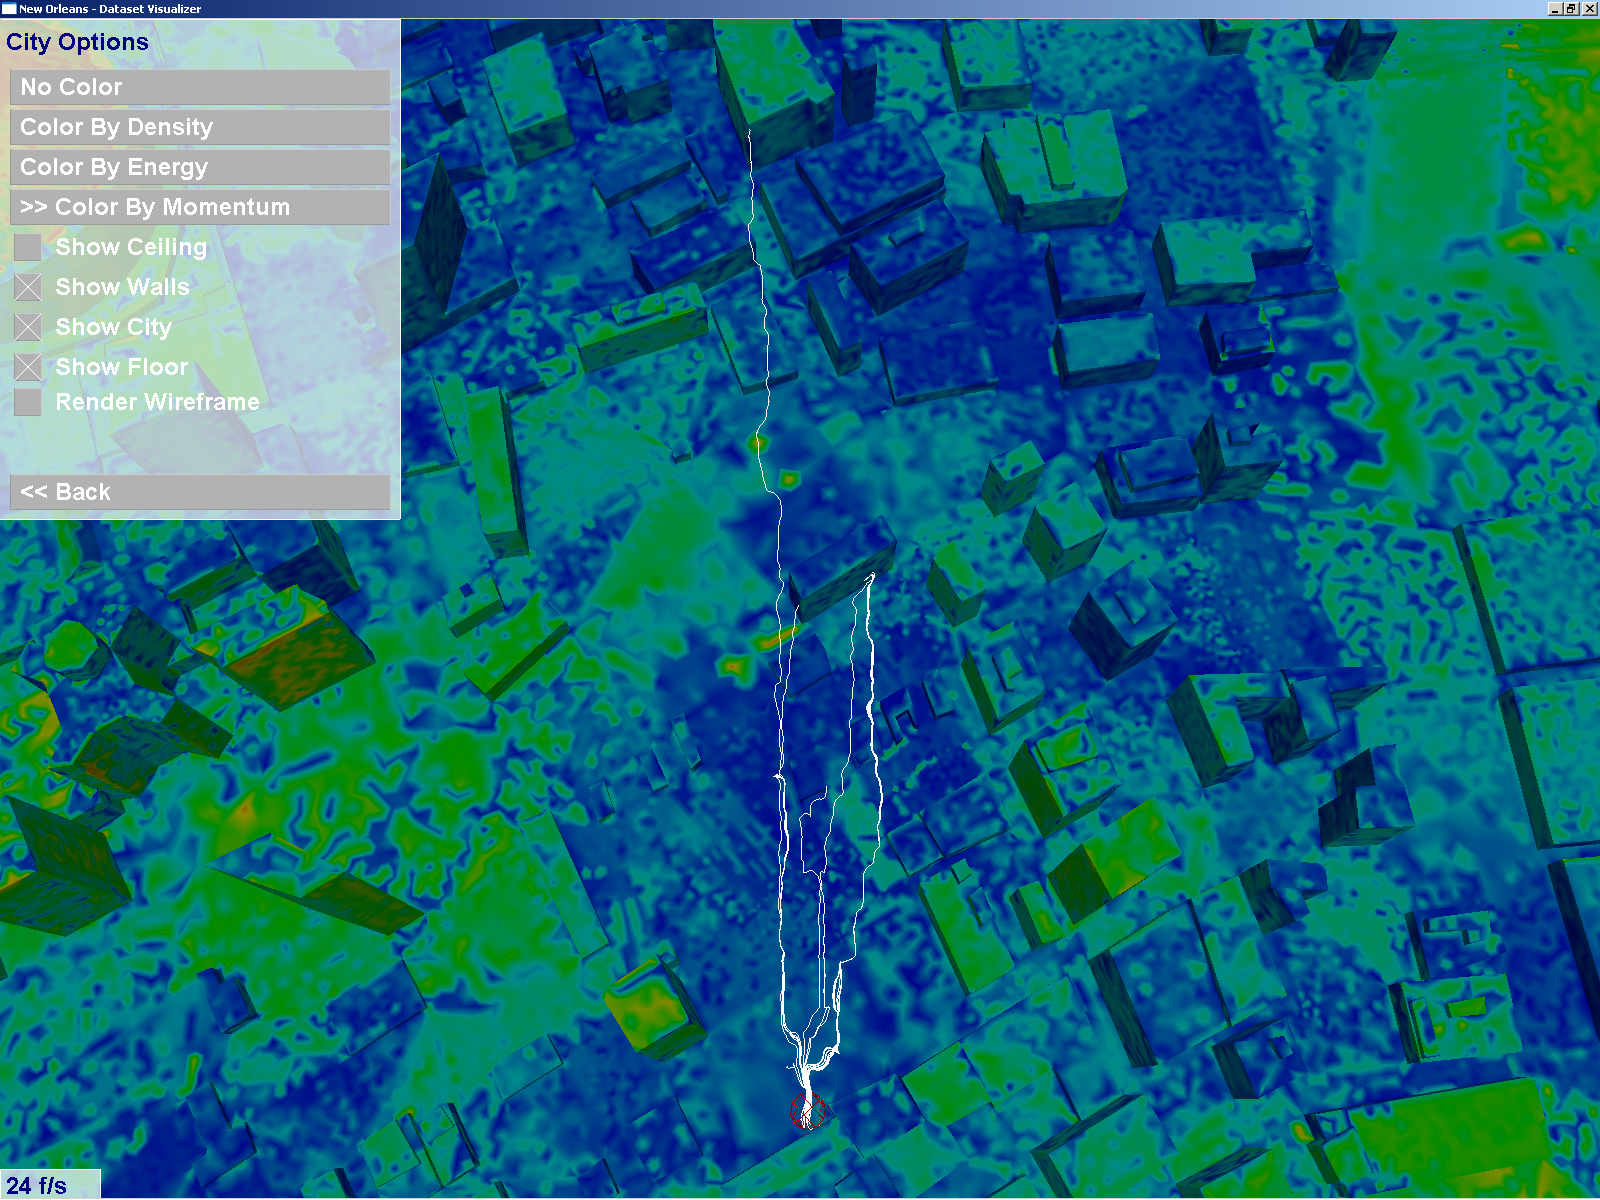
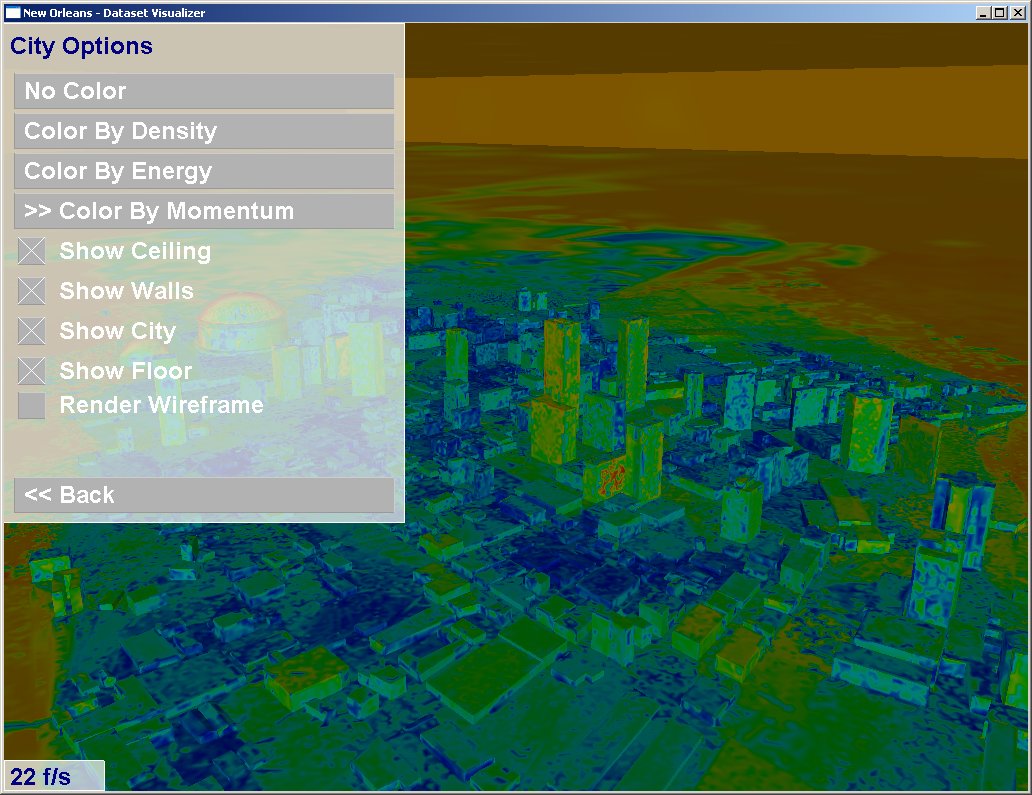
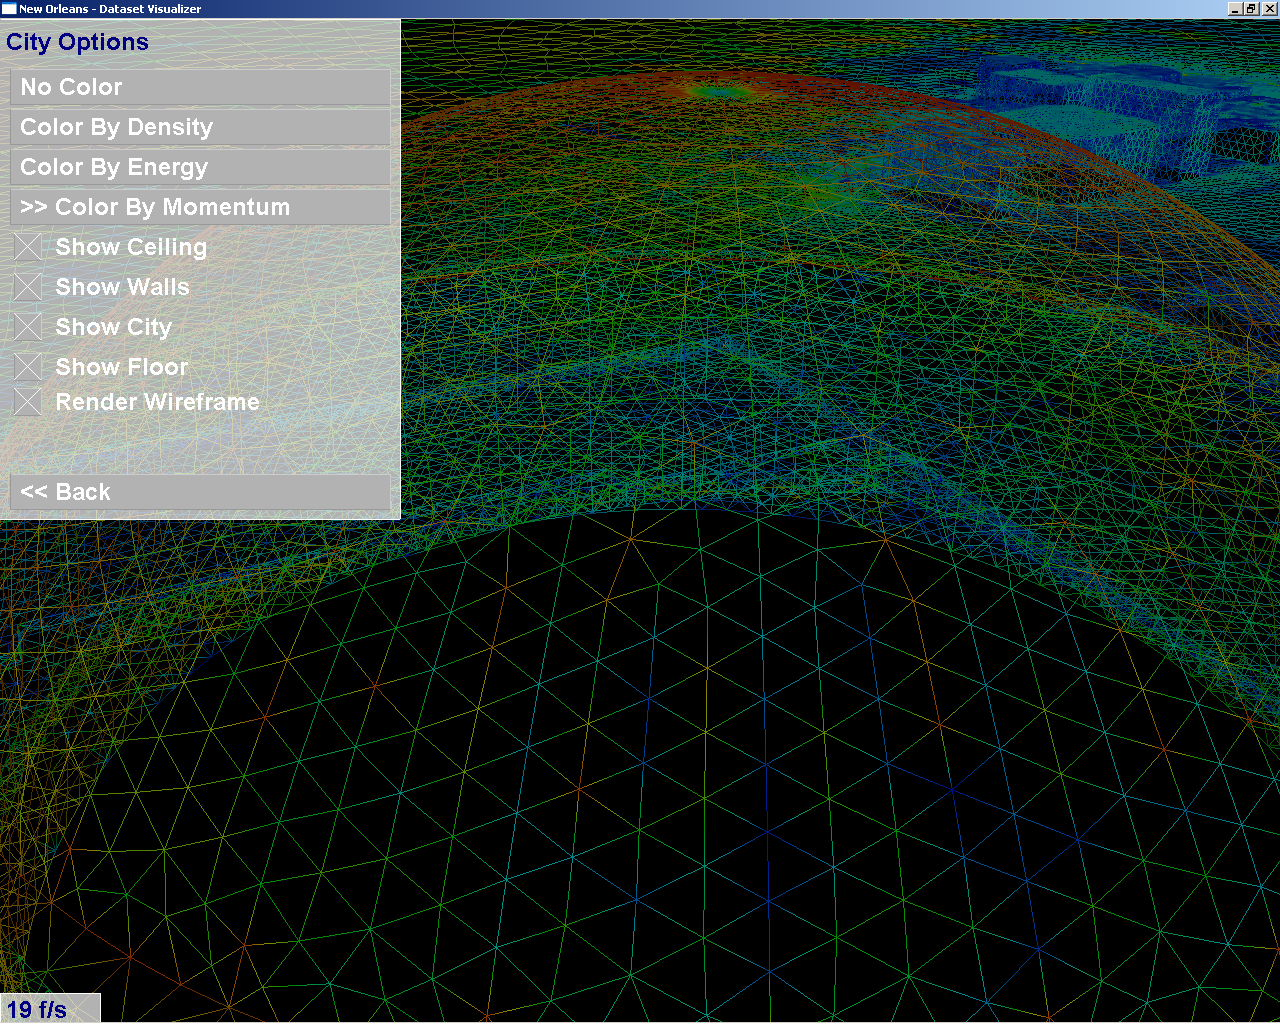
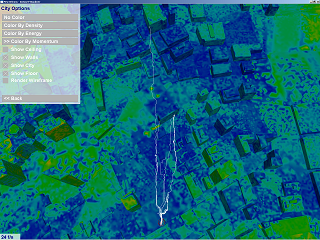
City Surface user interface |
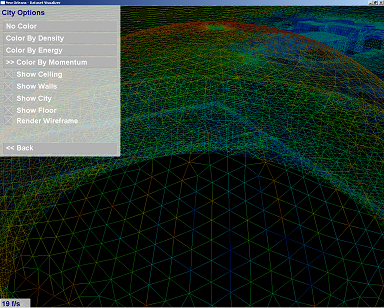 |
The top of the superdome, colored by Momentum Magnitude, in wireframe |
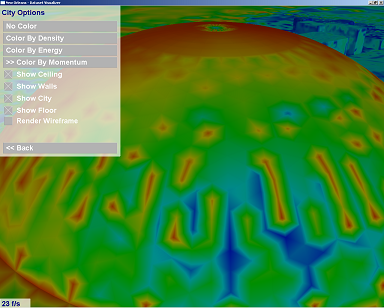 |
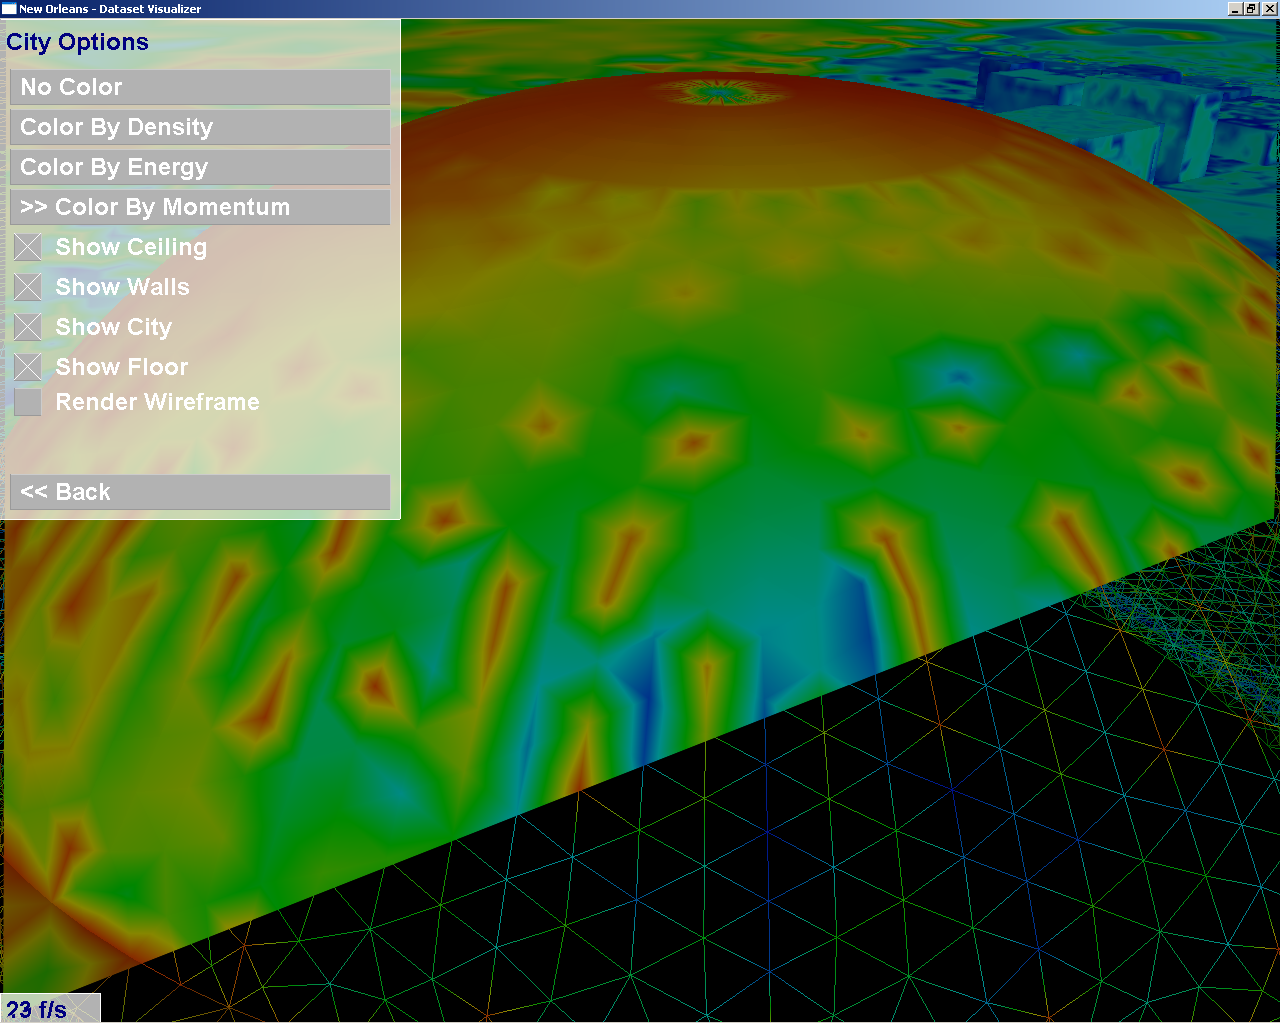
The top of the superdome, colored by Momentum Magnitude, in solid fill |
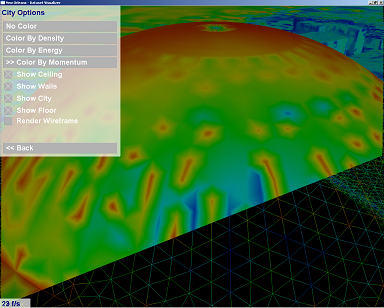 |
The top of the superdome, colored by Momentum Magnitude. At the joining point of the Wireframe & Solid fill portions you can see where the grid cells show both red and blue areas. Most visualizations would linearly interpolate between the two colors, but my system correctly inserts the green values that exist between them. |